A quantum-computing ticker near the top of an ETF gainers list can suggest investors are celebrating the technology. QBTZ demands the opposite reading. It is a bearish daily product tied to D-Wave Quantum, so weakness in D-Wave’s shares is the kind of move it is designed to amplify into a gain.
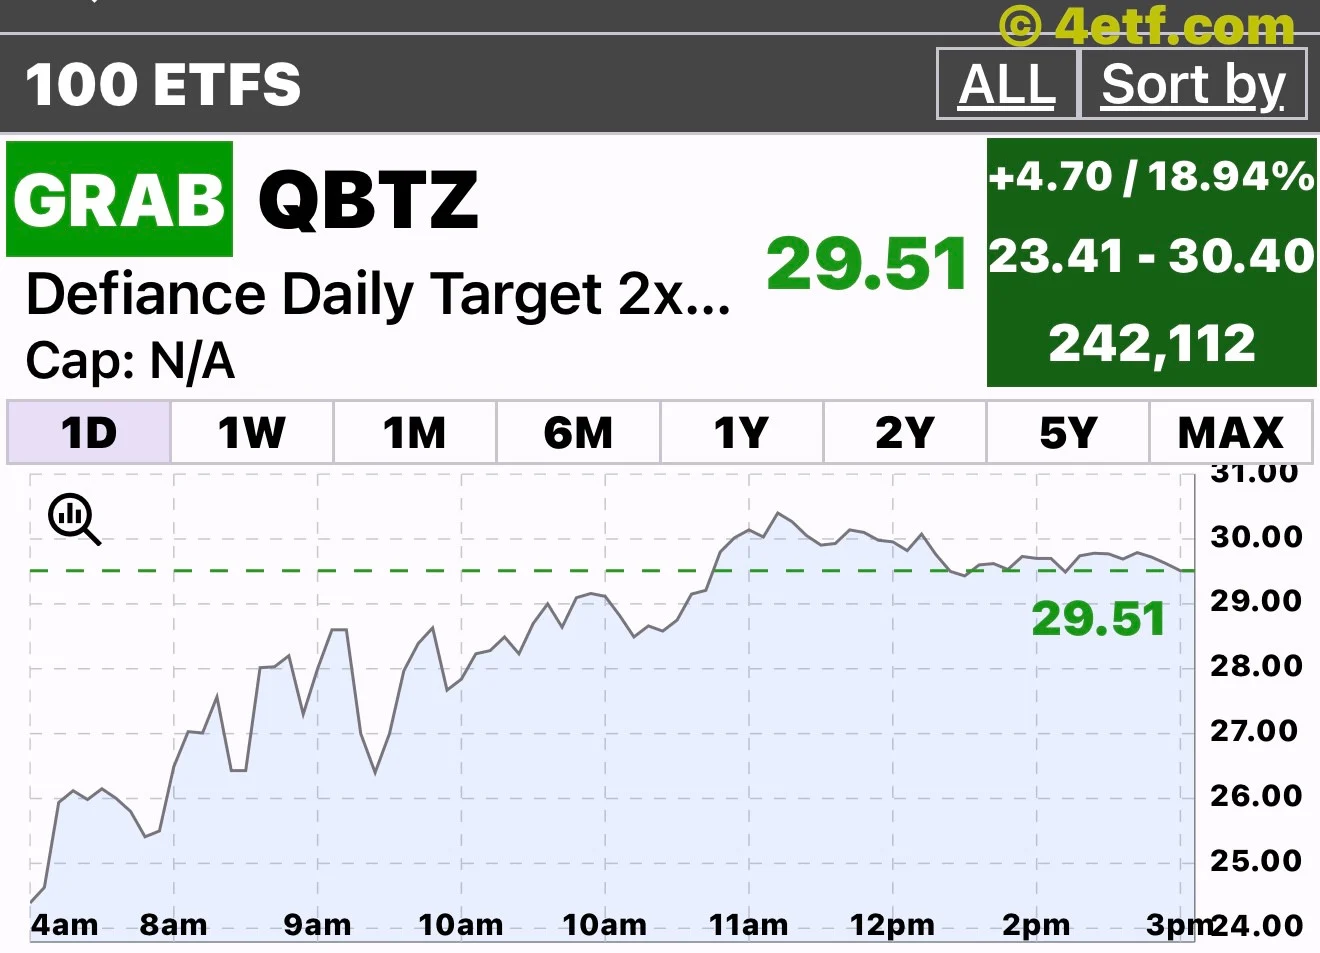
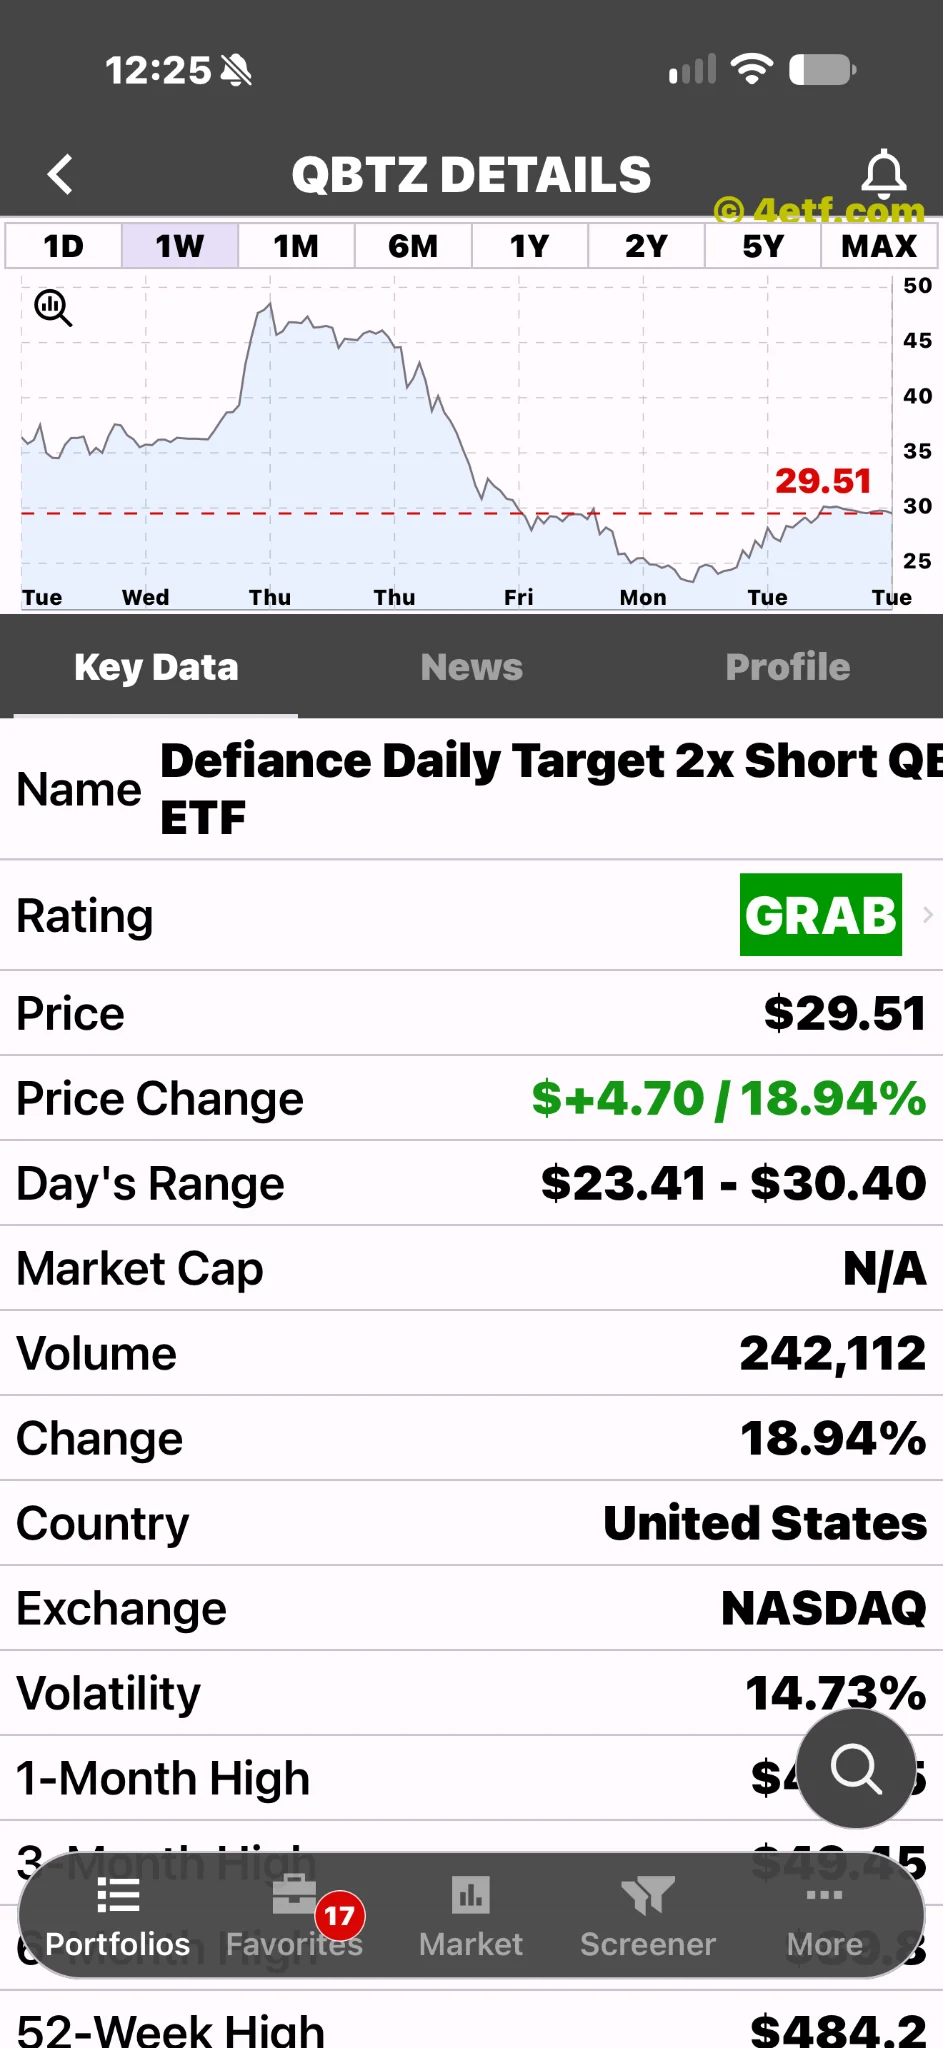
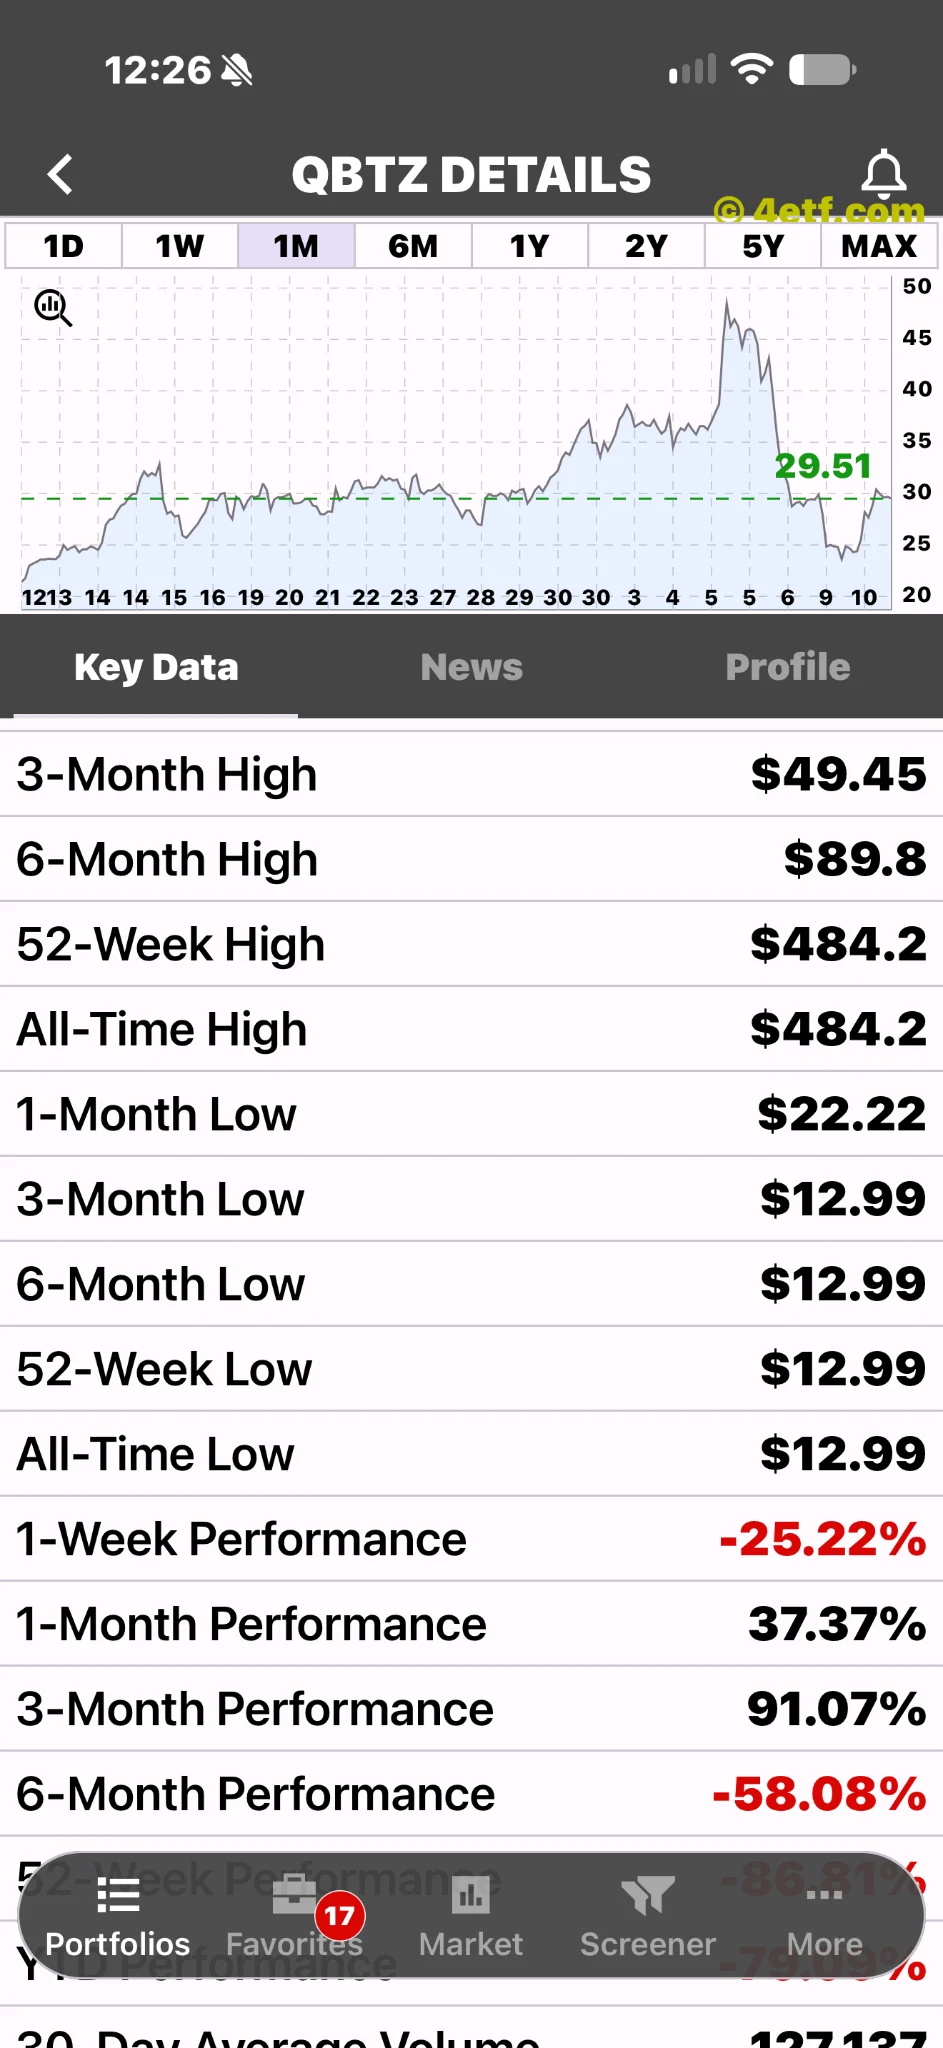
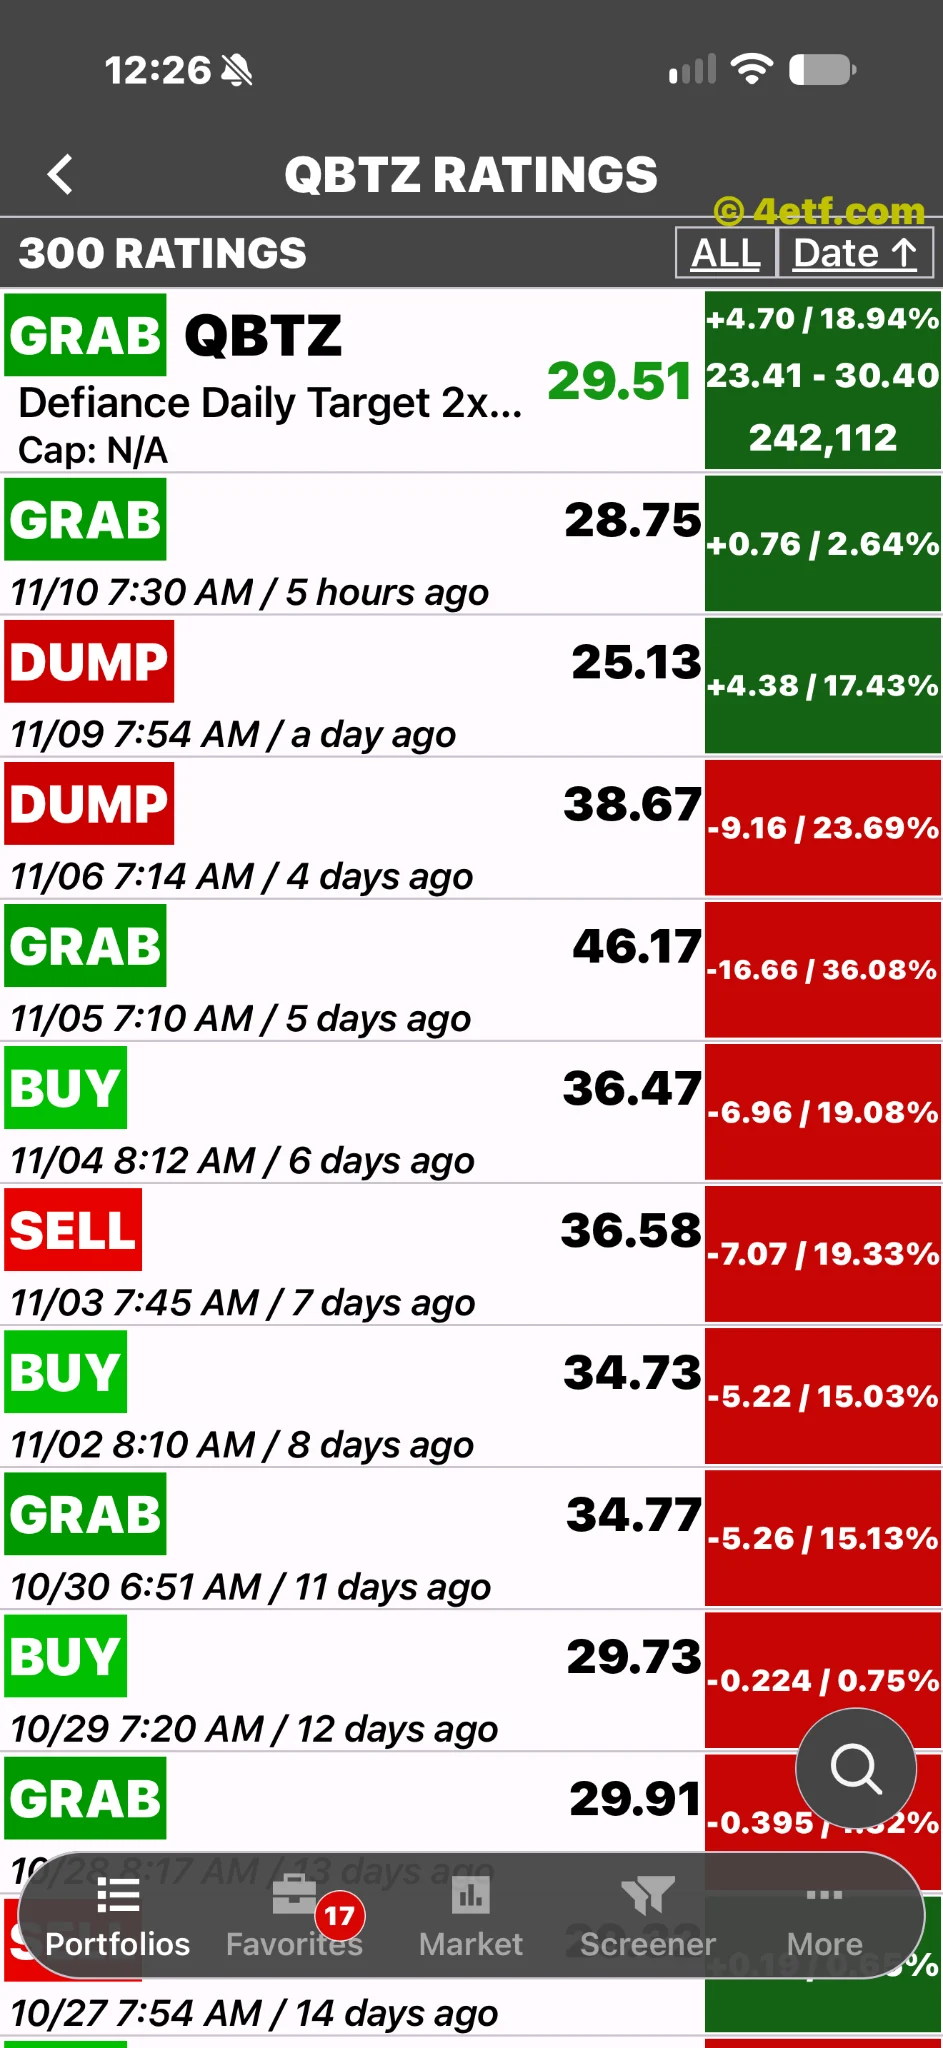
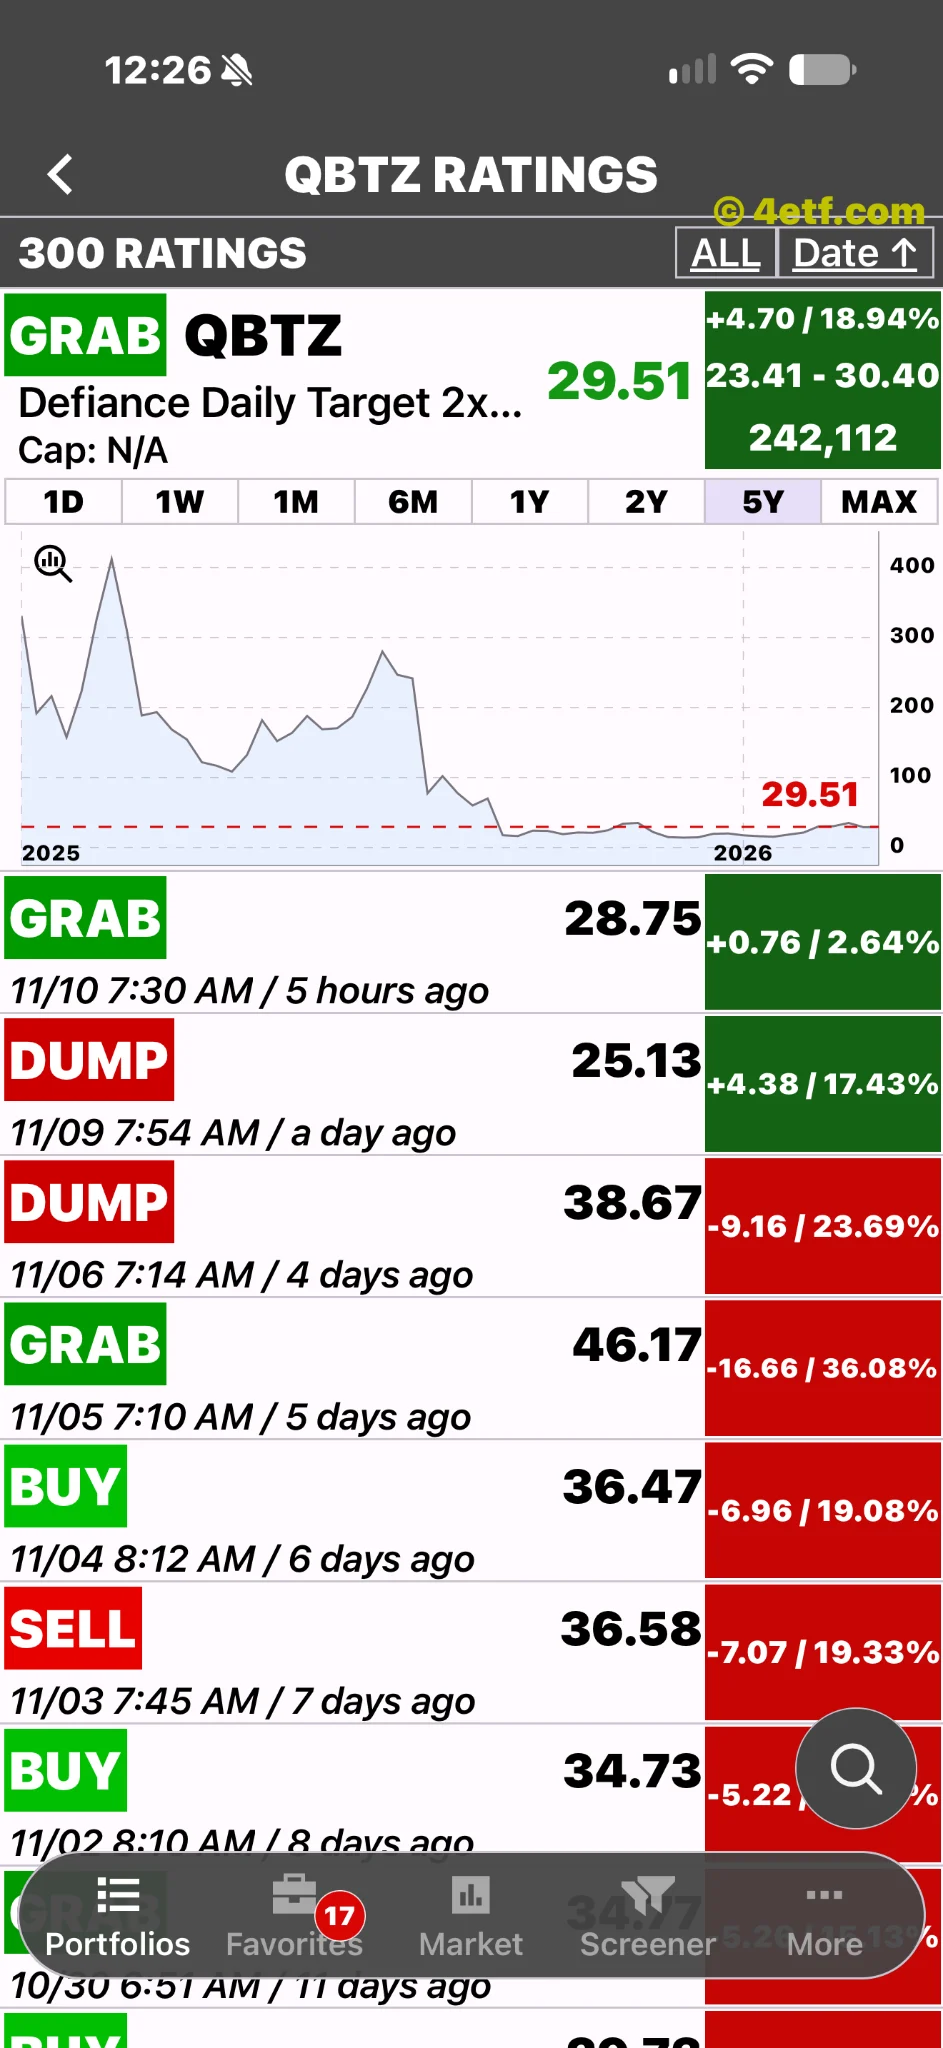
The supplied 4etf.com one-day chart shows QBTZ at $29.51 and a displayed increase of 18.94%. The earlier gainers list showed $29.35 and 18.30%. That is a screenshot value, not a confirmed closing return. The image lacks a dated exchange quote, and its device clock does not establish the quote’s timezone or freshness. The reporting below concerns the November 10, 2026 U.S. session and keeps that separate from the image’s unresolved timing.
The underlying business grew, but so did its costs
D-Wave’s November 10 results reported third-quarter revenue of $4.5 million, up 21% year over year, against operating expenses of $55.9 million, up 84%. The company also reported $38.3 million in remaining performance obligations. These numbers describe a business building commercial demand while spending at a scale far above current quarterly sales.
Benzinga reported that QBTS fell in premarket trading after the release of mixed results. A subsequent 24/7 Wall St. report put the shares at $10.68, down about 7%, in morning trading. Those observations support the direction of the earnings response. Neither quote is synchronized with the supplied QBTZ screenshot, so they cannot establish its precise tracking performance.
Our assessment is that the tension between present revenue and the cost of expansion is more informative than calling the report simply good or bad. Revenue growth can support the long-term case while still falling short of what a market valuation requires. The stronger spending increase gives investors a reason to ask how much additional business must arrive before the economics improve.
The minus sign is the investment thesis
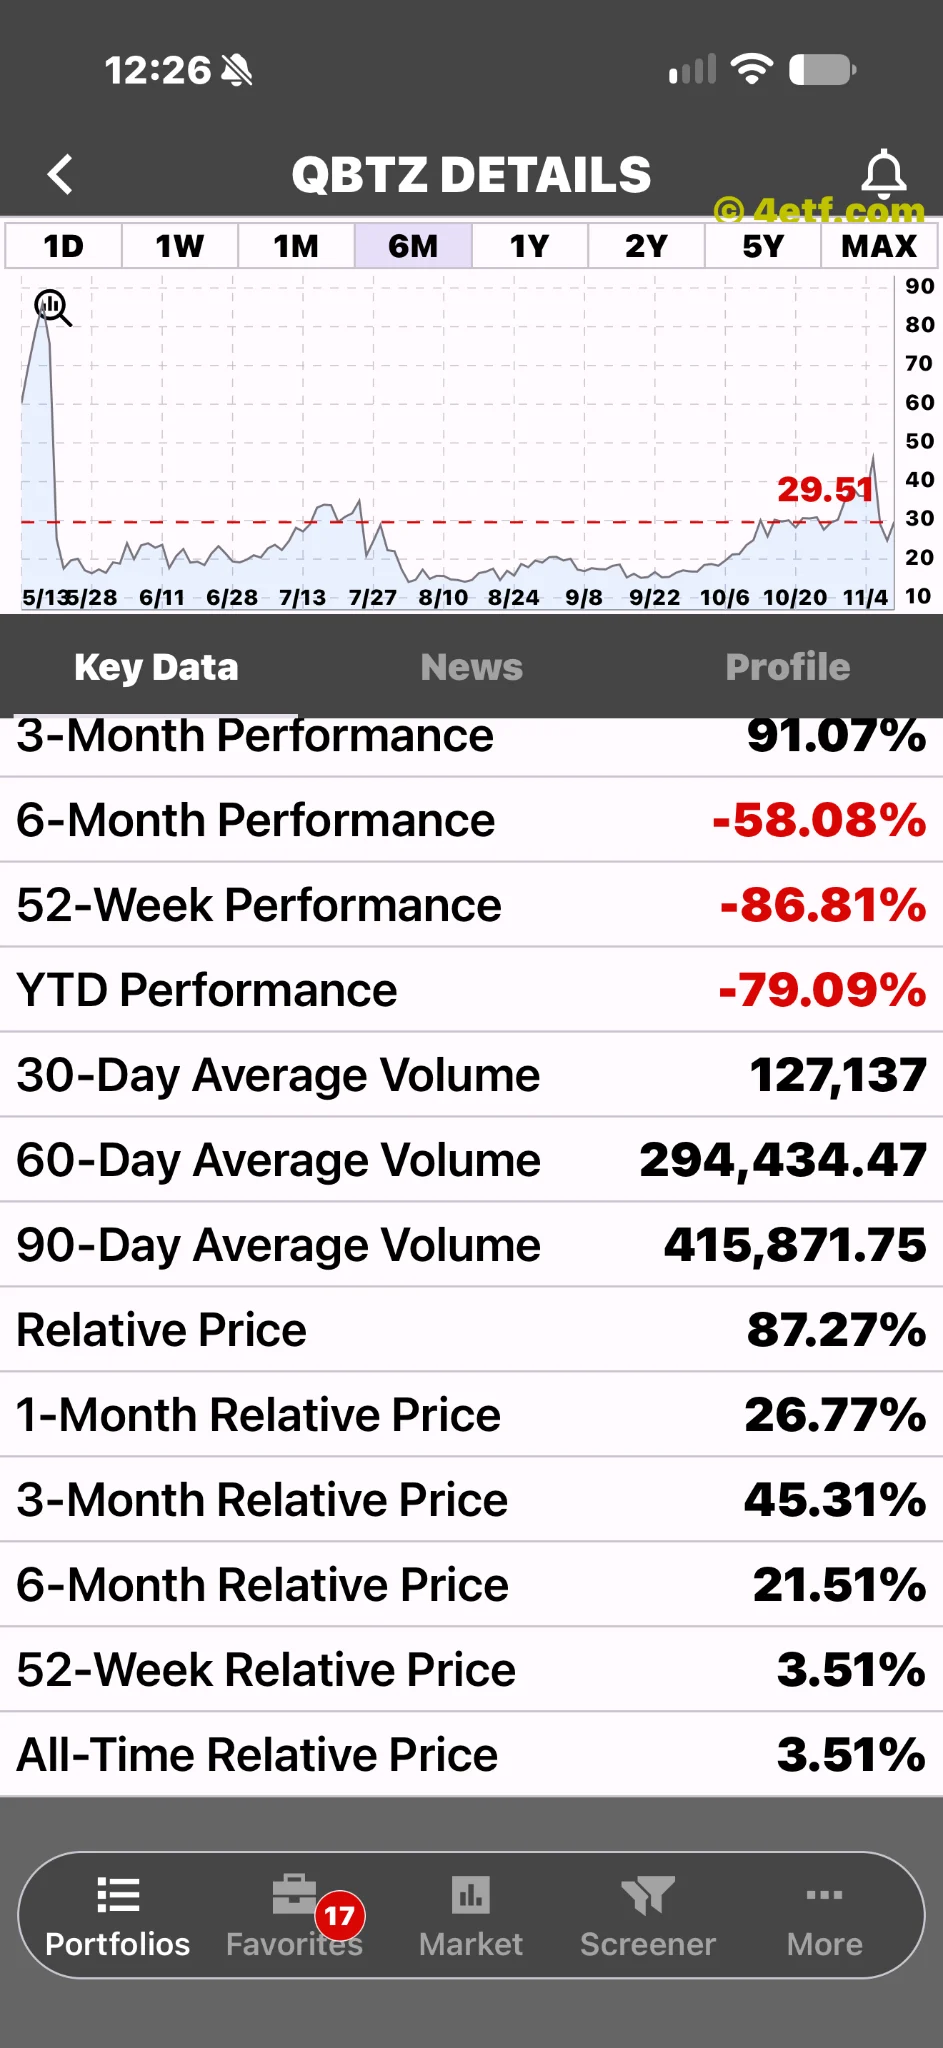
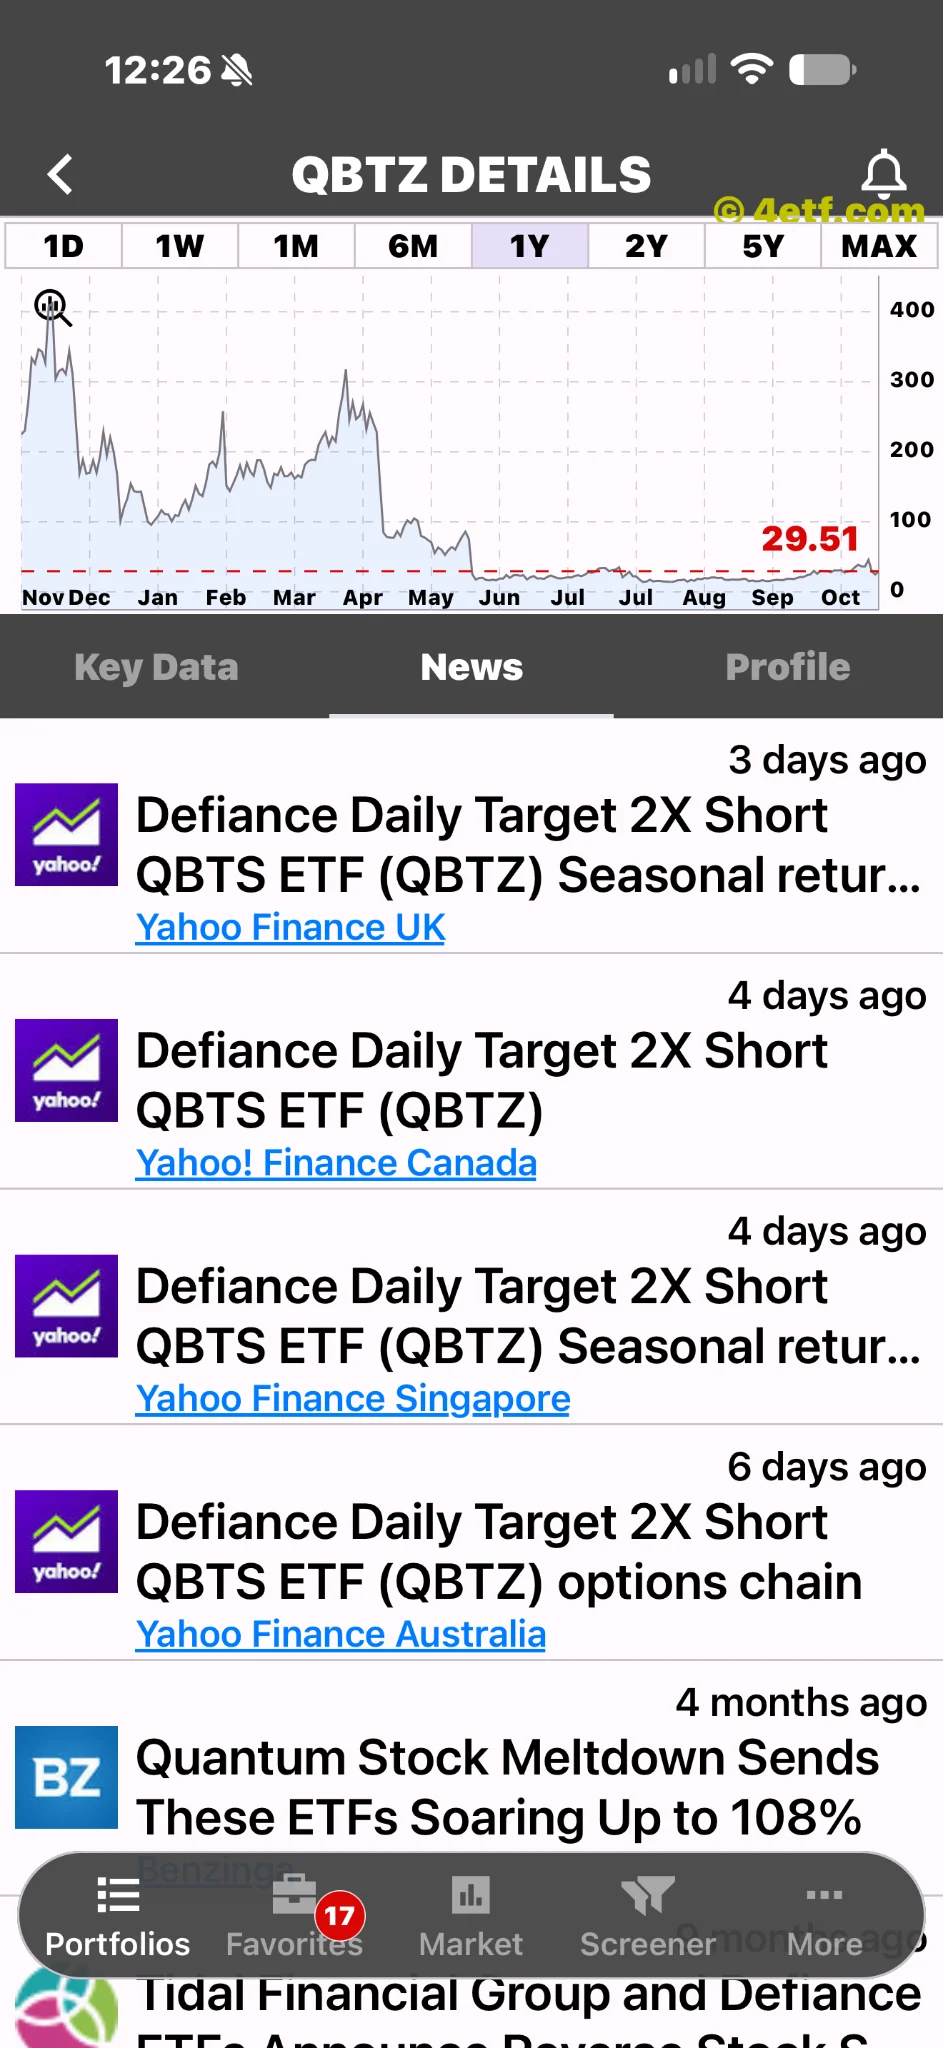
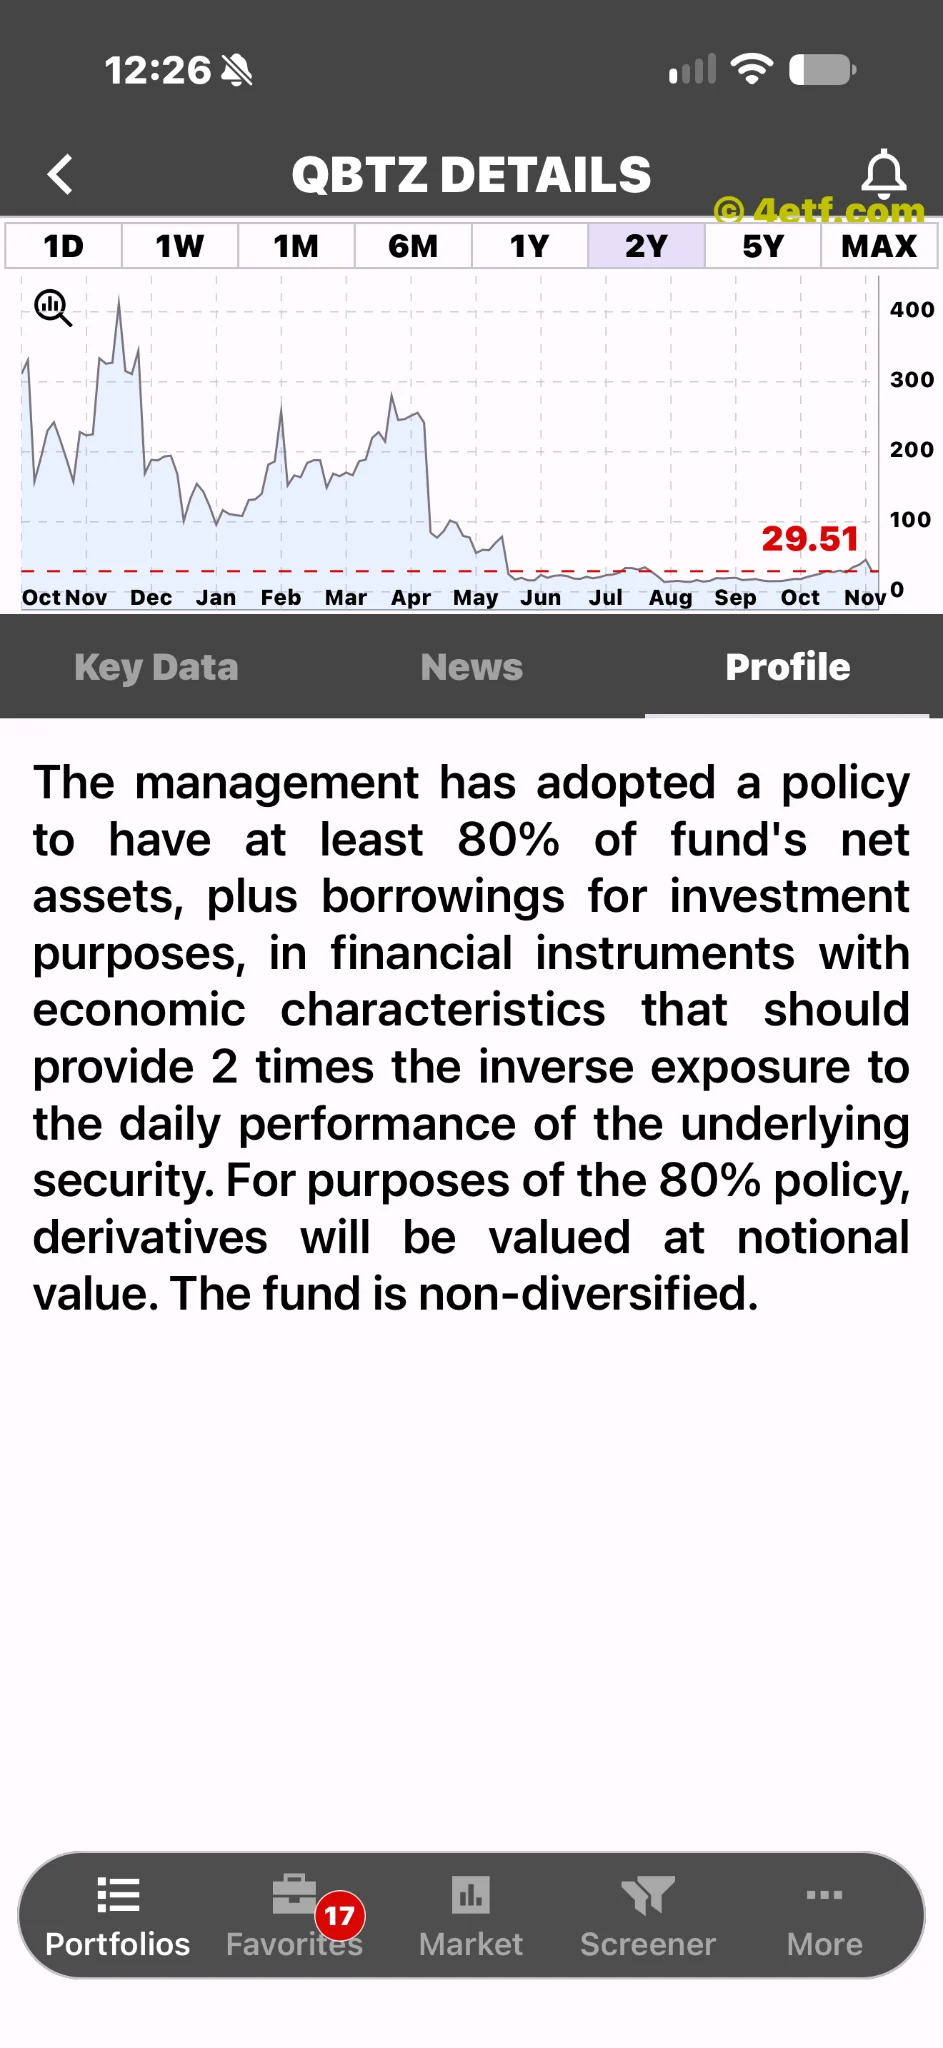
Defiance says QBTZ seeks minus twice the daily percentage change in QBTS before fees and expenses. It is therefore not a conventional fund owning a basket of quantum companies. A holder is taking an amplified, short-horizon position against one stock.
In a simplified example, a 9% decline in the underlying would imply an 18% target gain before costs. The reverse is equally important: a 9% rise would imply an 18% target loss. These are hypothetical daily calculations, not forecasts. An intraday buyer’s experience also depends on the price and time of entry, not just the fund’s stated daily objective.
The direction of the bet matters more than its position on a green leaderboard. Buying QBTZ because quantum computing looks promising would conflict with the product’s intended exposure. Its gain is evidence to investigate D-Wave’s weakness, rather than evidence of broad enthusiasm for quantum shares.
Backlog can challenge a bearish reading
Remaining performance obligations provide a counterpoint to weak near-term profitability. They concern contracted revenue not yet recognized, rather than sales already reported for the quarter. The analytical test is conversion: how quickly those obligations become recognized sales, what margins they produce and whether growth begins to outpace the expansion of costs.
A bearish ETF holder also faces the possibility of a strong company announcement or a recovery in sentiment. Even a well-researched long-term concern does not determine the next trading day’s return. A rebound can hurt an inverse position before the fundamental question is resolved.
The SEC warns that single-stock ETFs remove the diversification normally associated with a broad fund. Daily resetting also means that a multiday result is not simply minus twice the stock’s total return. QBTZ’s large displayed gain is therefore best understood as a leveraged response to a falling reference stock, with substantial reversal risk. The next earnings evidence and the next executable quote serve different purposes, and both matter.