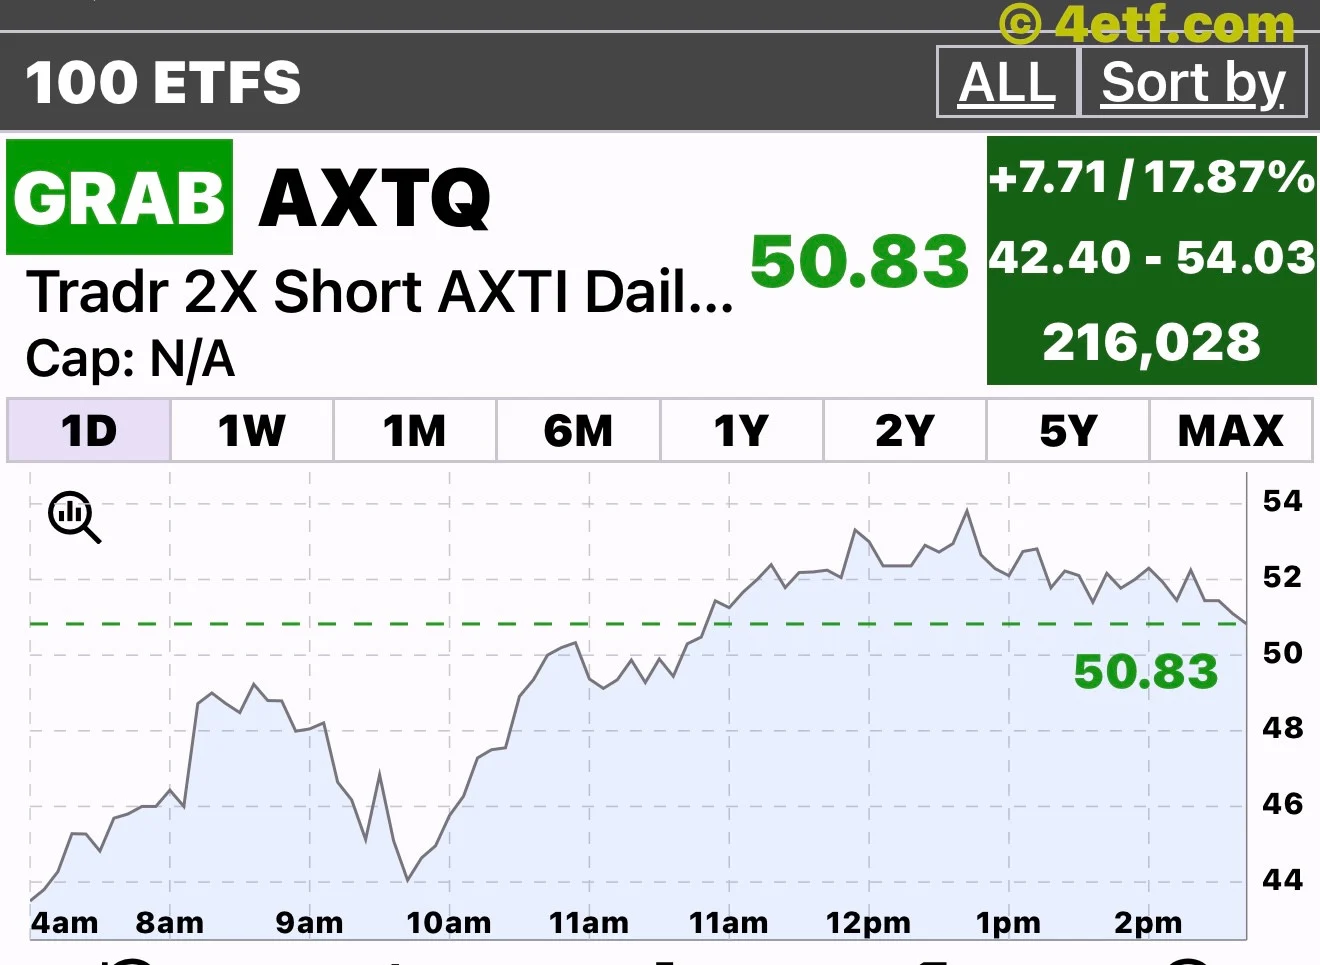
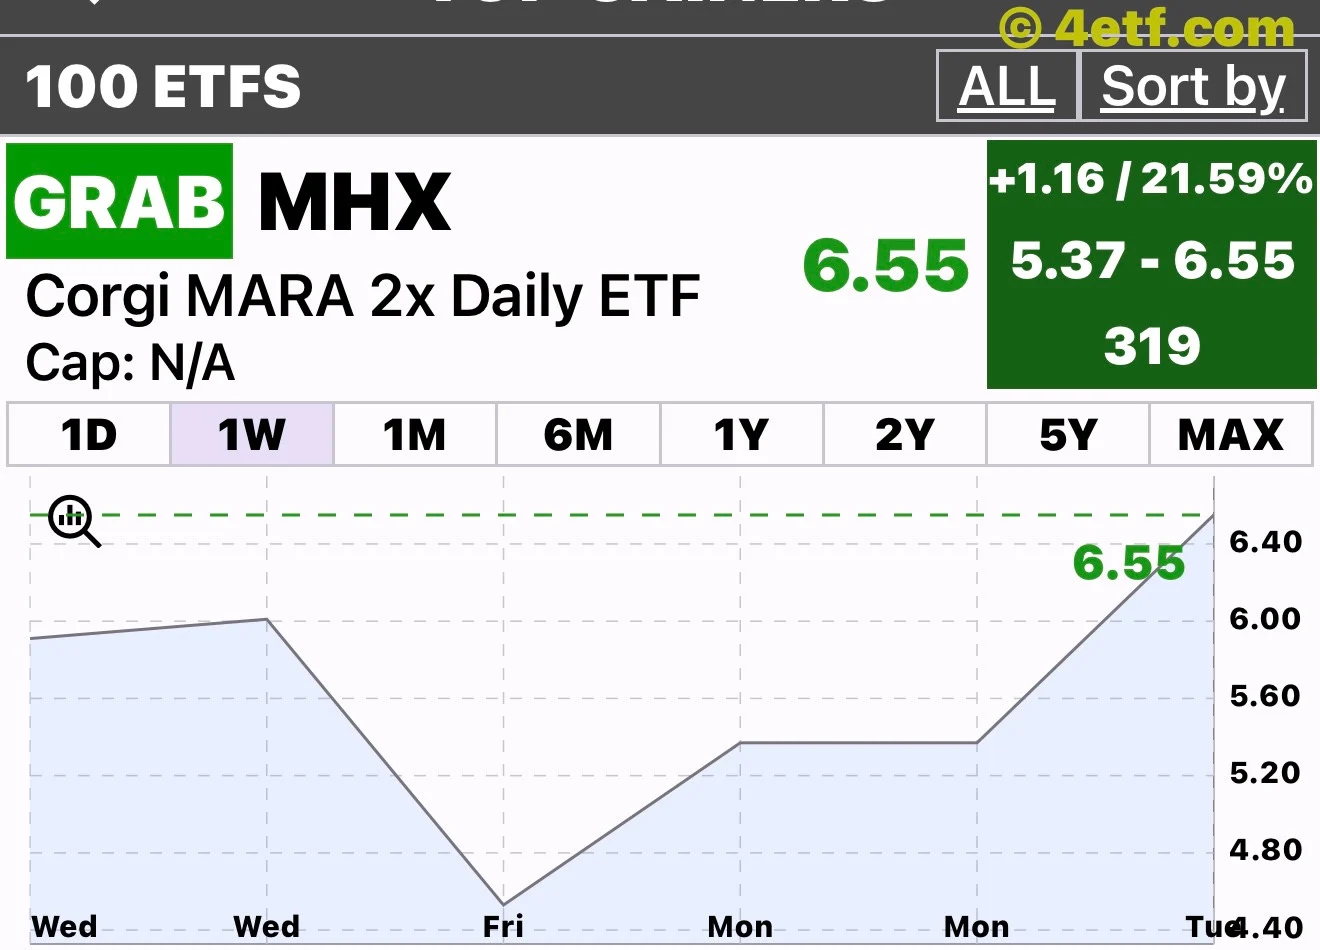
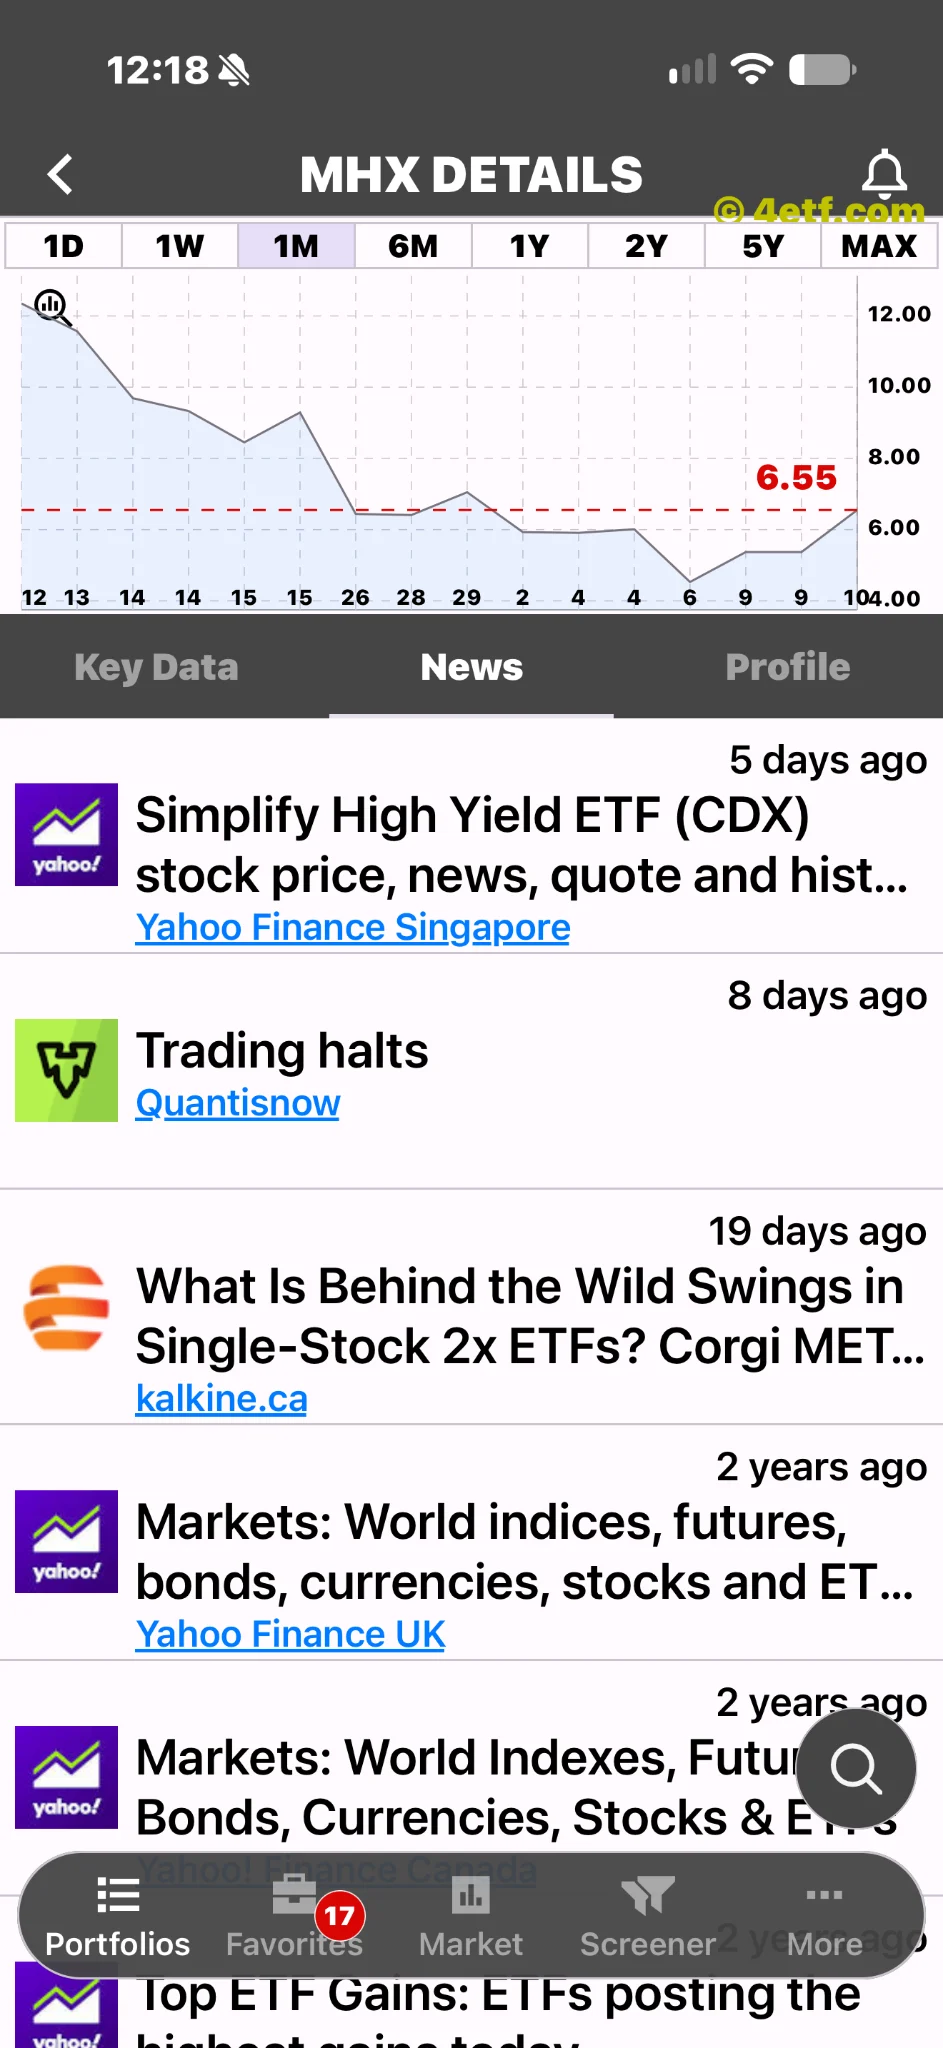
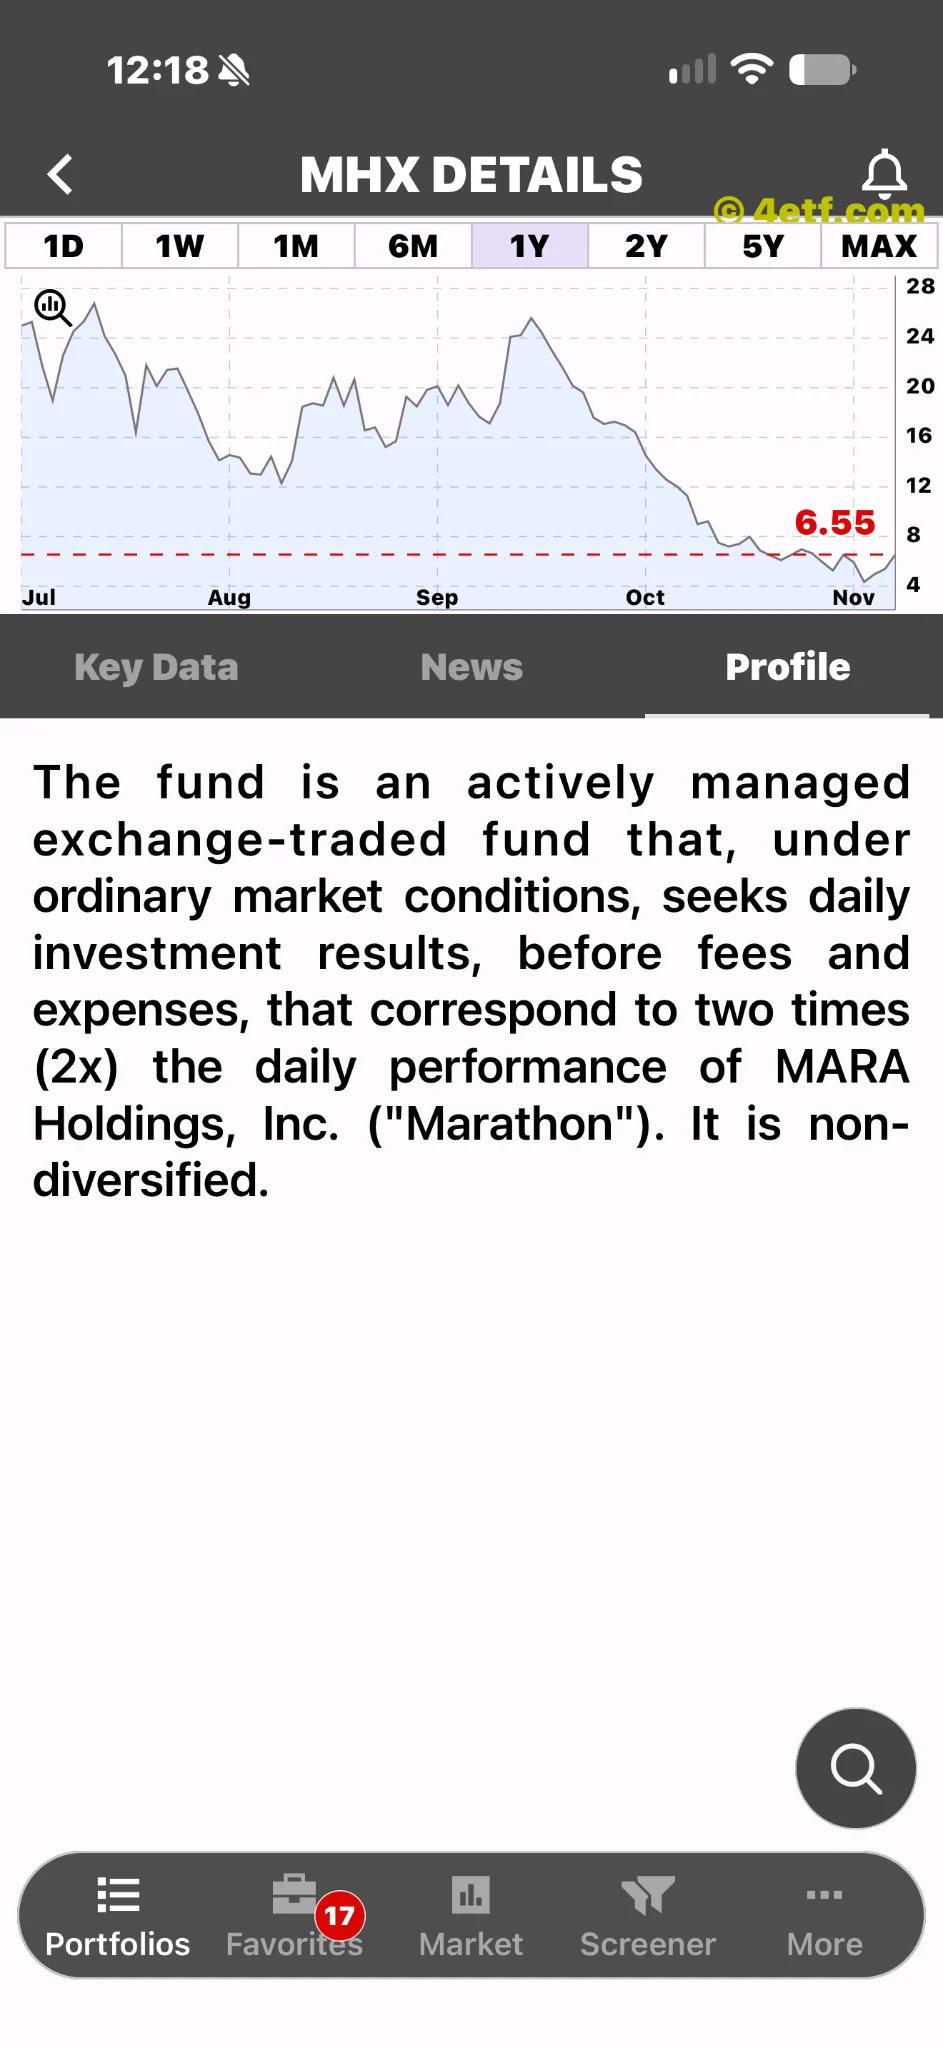
A green number above 20% can make a fund look like a new market leader. In the supplied MHX screen, the more revealing comparison is between that jump and the longer chart: a sharp rebound sits inside a substantial decline. The first question is what changed at MARA Holdings, the company behind this leveraged trade.
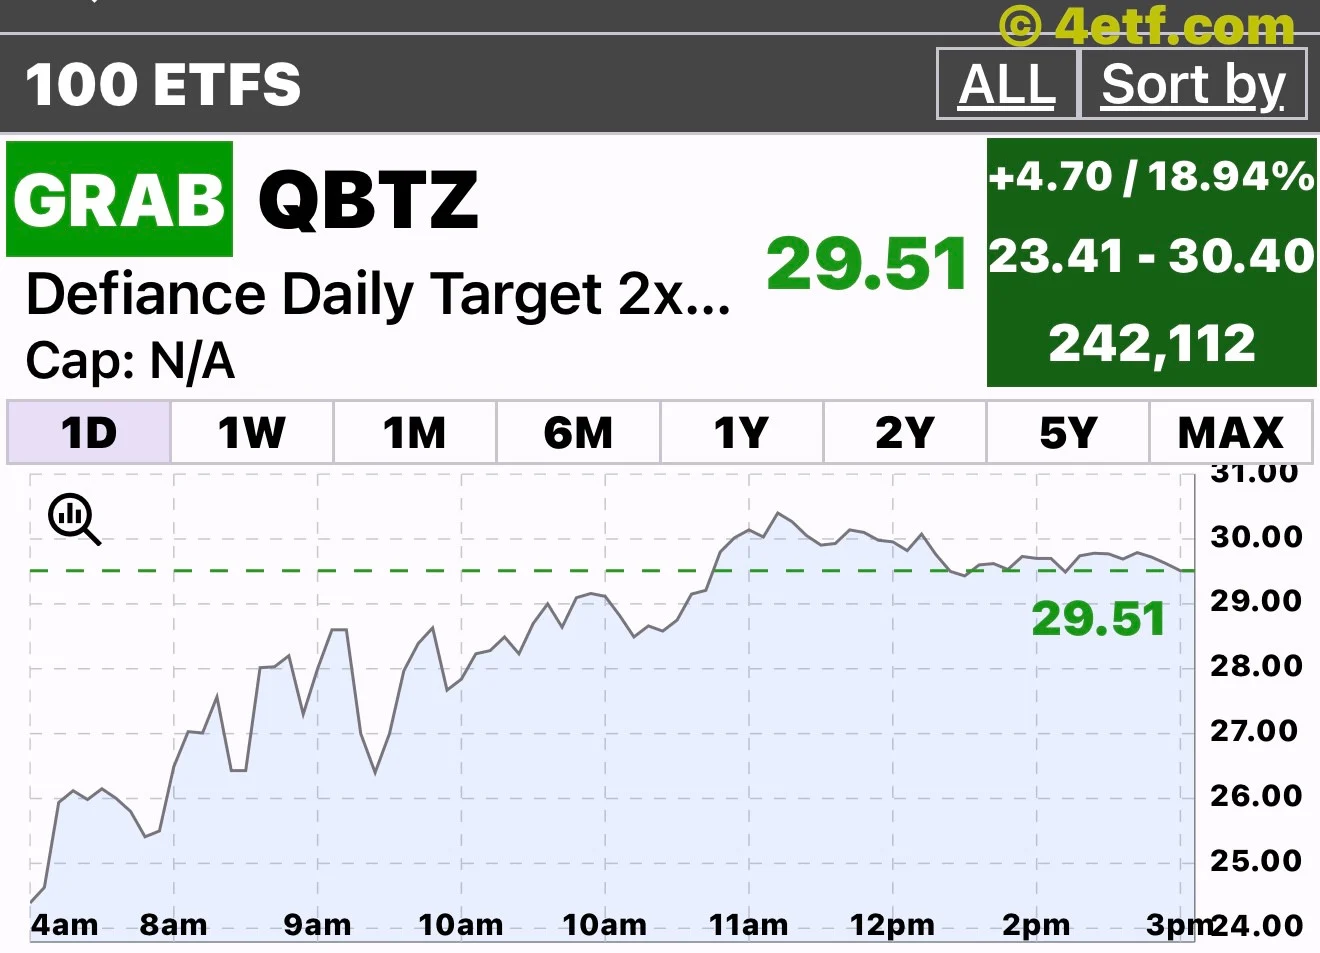
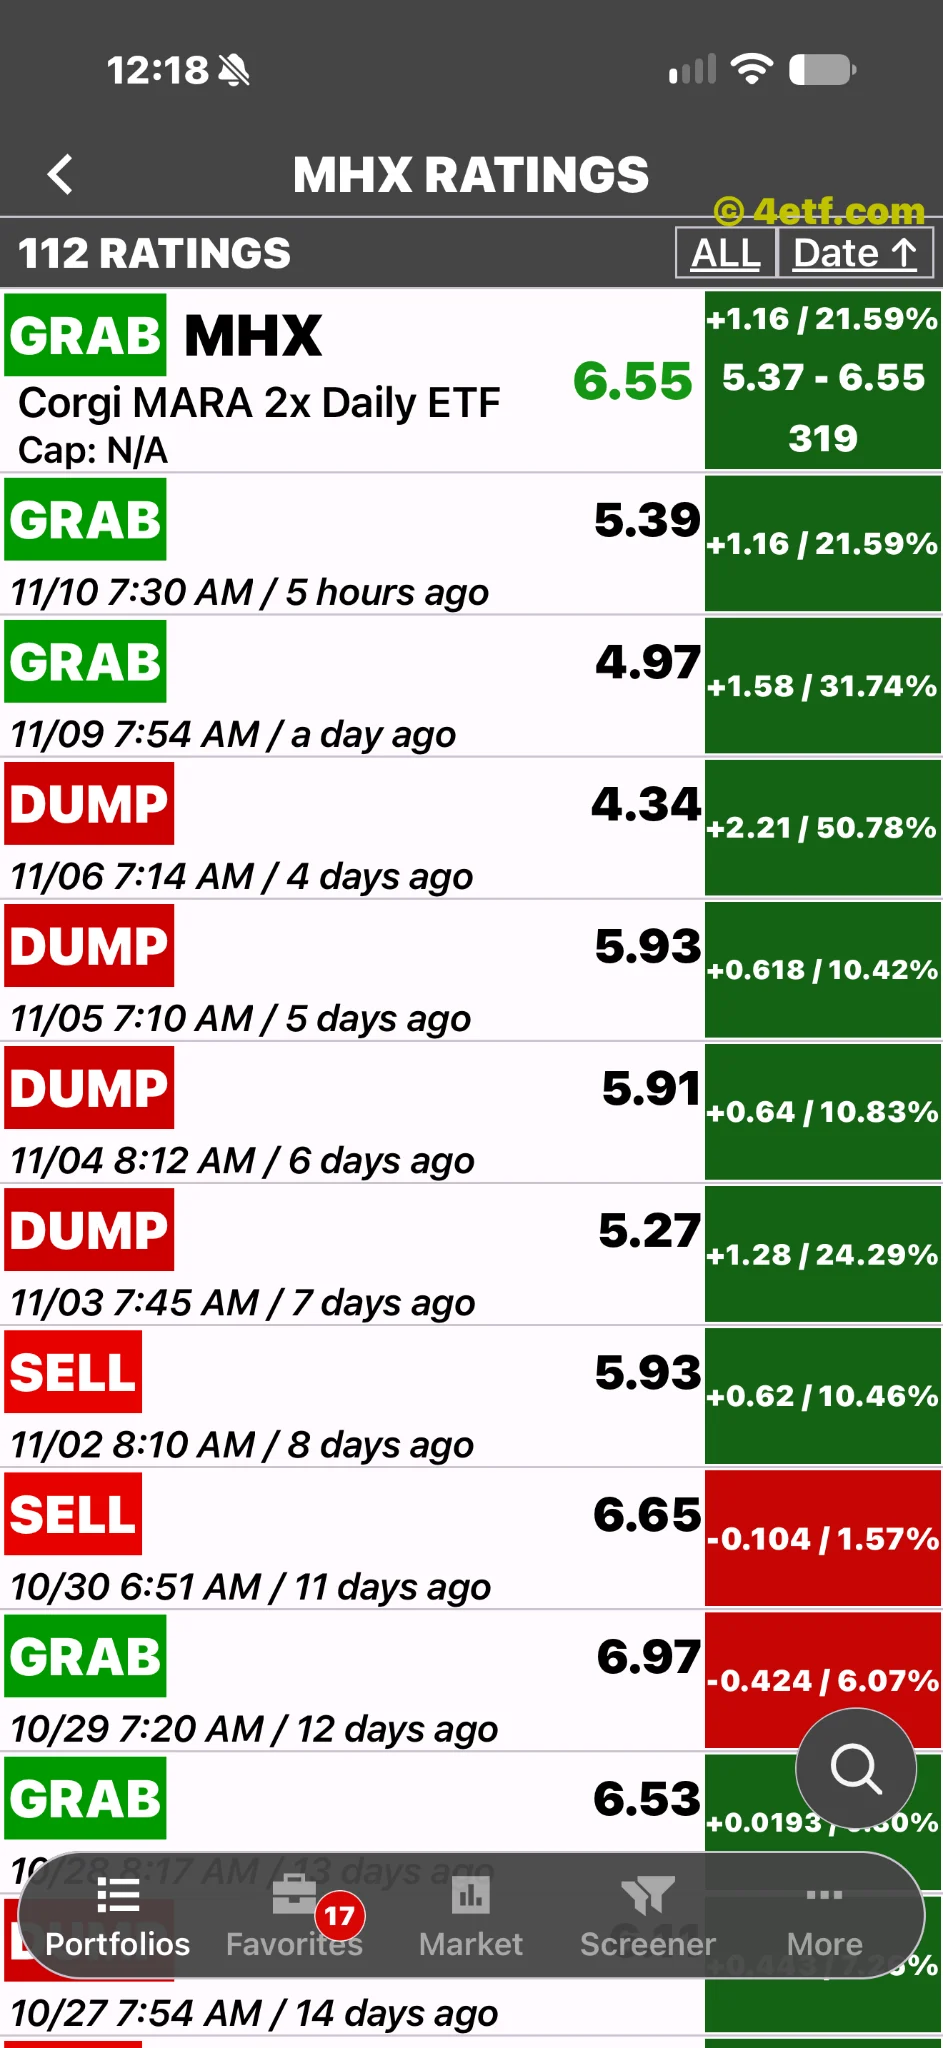
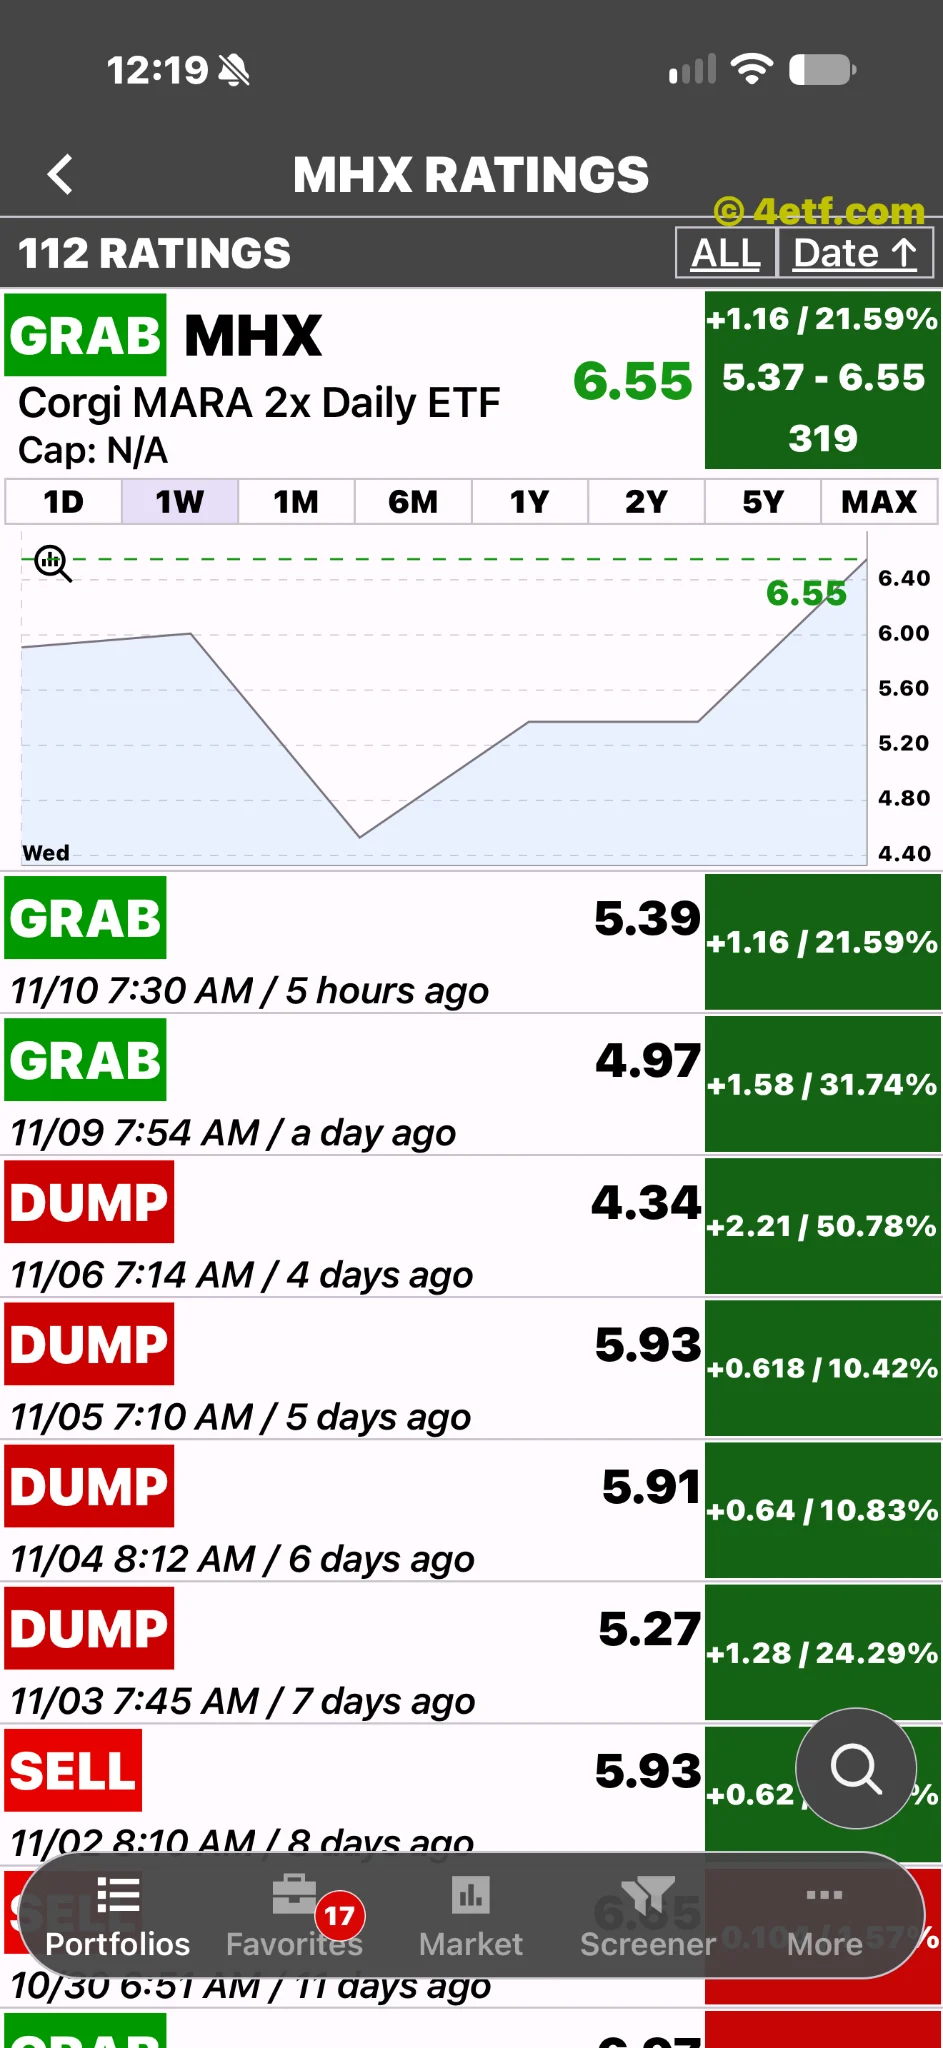
Research for this article concerns the November 10, 2026 U.S. trading session. The supplied 4etf.com screen shows MHX at $6.55 with a displayed gain of 21.59%. A later supplied MRAL chart shows $13.08 with 16.81%, versus $12.92 and 15.36% in the earlier gainers list. These are screenshot observations, not independently verified closing returns. The images do not establish a synchronized exchange timestamp or the exact comparison price used by every row.
A buyback changes the conversation after earnings
MARA’s November 9 shareholder letter disclosed authorization to repurchase up to $500 million of common stock. It also reported quarterly revenue of $164.2 million, down 35%, and net income of $632.1 million that benefited from an $885.3 million unrealized bitcoin gain. Management targeted two leases before year-end but warned that timing could slip. Those details support a mixed reading: a shareholder-return initiative and development ambitions alongside weaker revenue and earnings heavily influenced by asset revaluation.
The next morning, a report carried by Yahoo Finance said that MARA opened at $7.51, 12.88% above Monday’s level. Its November 10 report connected the post-earnings rise with the buyback announcement and debt repayment. This is contemporaneous evidence of a positive market response, although it does not prove which announcement motivated each buyer.
Our assessment is that the buyback makes the rally understandable without making it self-sustaining. An authorization gives management a choice. It does not establish how many shares have already been bought, at what prices, or how much capital will ultimately be used.
Two funds magnify the same underlying stock
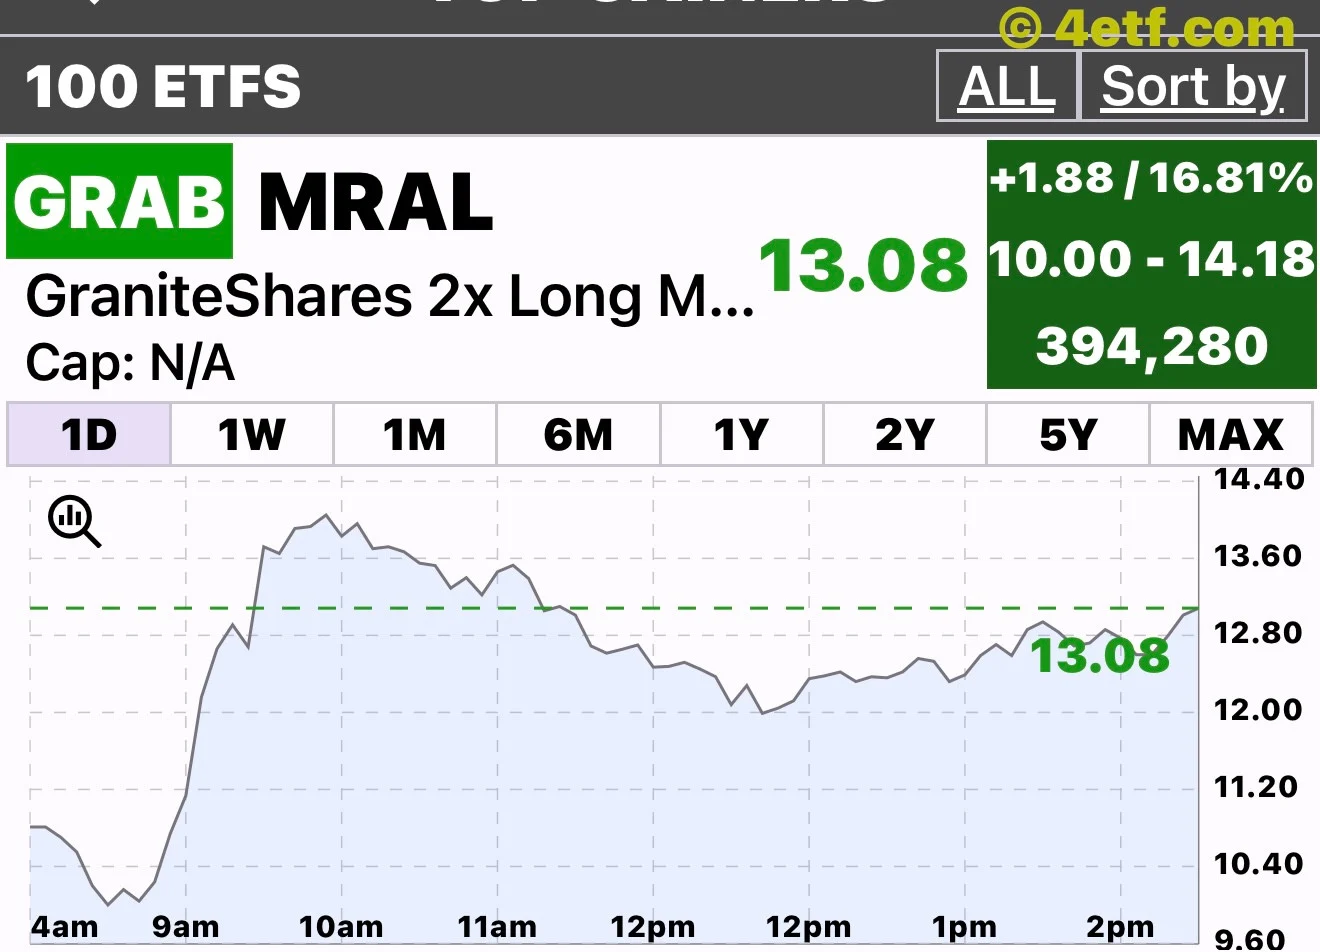
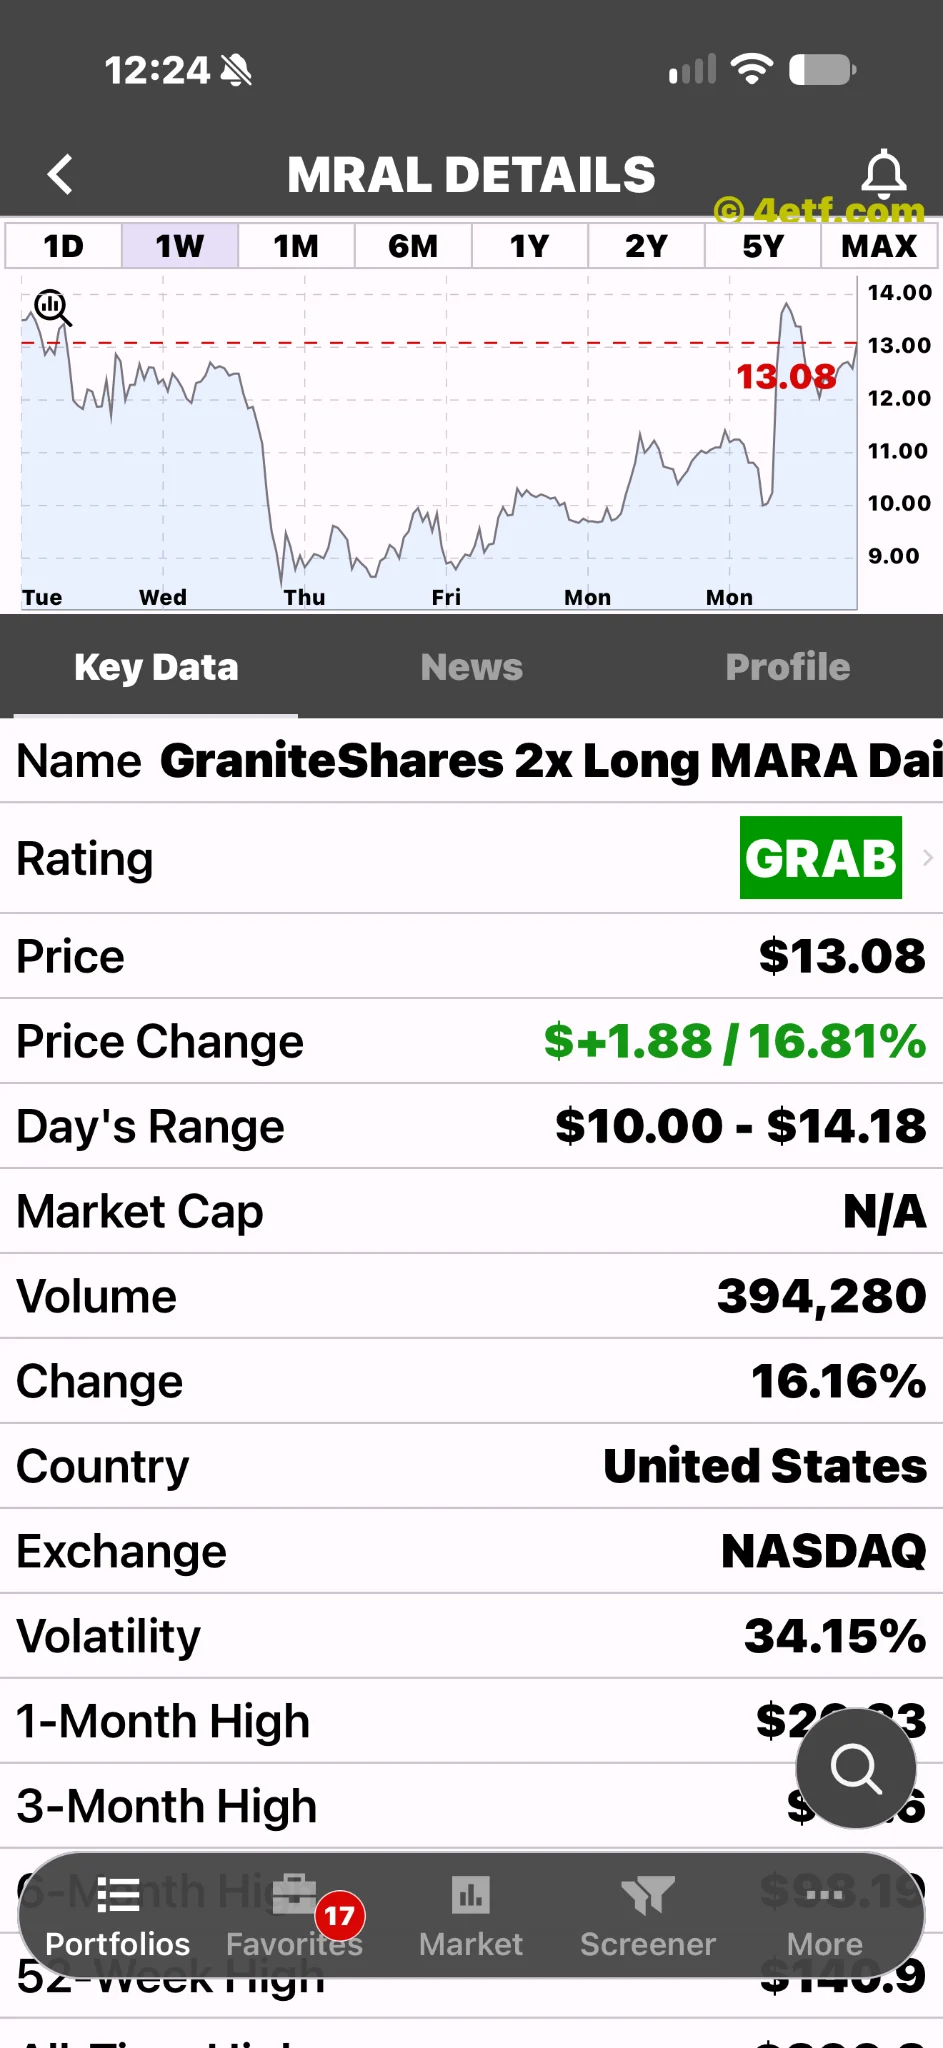
Corgi’s MHX targets twice MARA’s daily performance before fees and expenses. GraniteShares’ MRAL has the same daily 2× objective. Owning both therefore repeats the central MARA exposure rather than creating a diversified basket of businesses.
For illustration, a hypothetical 8% daily rise in MARA points to a 16% target move in a 2× product before costs and tracking differences. This is arithmetic, not a forecast or a reconstruction of the screenshot. Different last-trade times, spreads and market prices can prevent two screens from showing identical returns.
MHX’s supplied image shows volume of only 319 shares. That makes the quote’s freshness and the available bid and offer especially important to check. It does not tell us the fund’s net inflows, how much exposure its derivatives carry, or the price available for a larger order. The app’s “GRAB” label is the app’s signal, not this article’s recommendation.
The longer chart asks a harder question
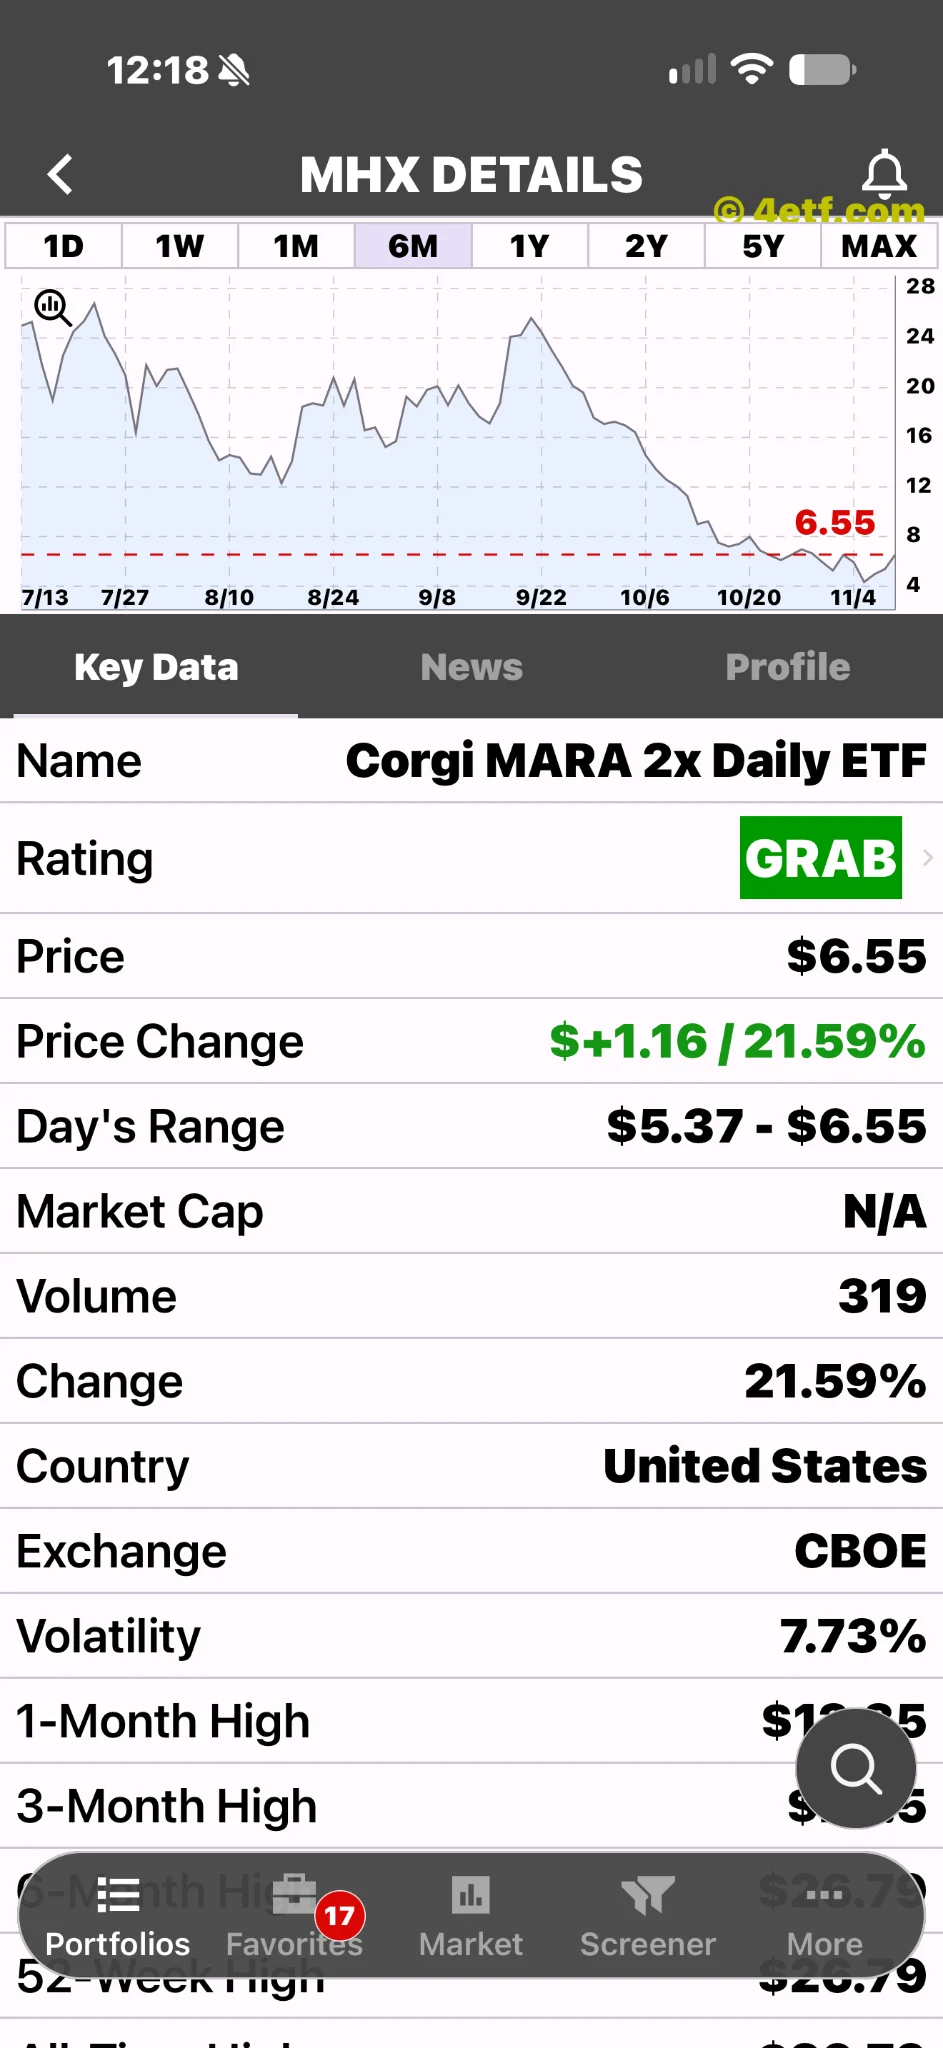
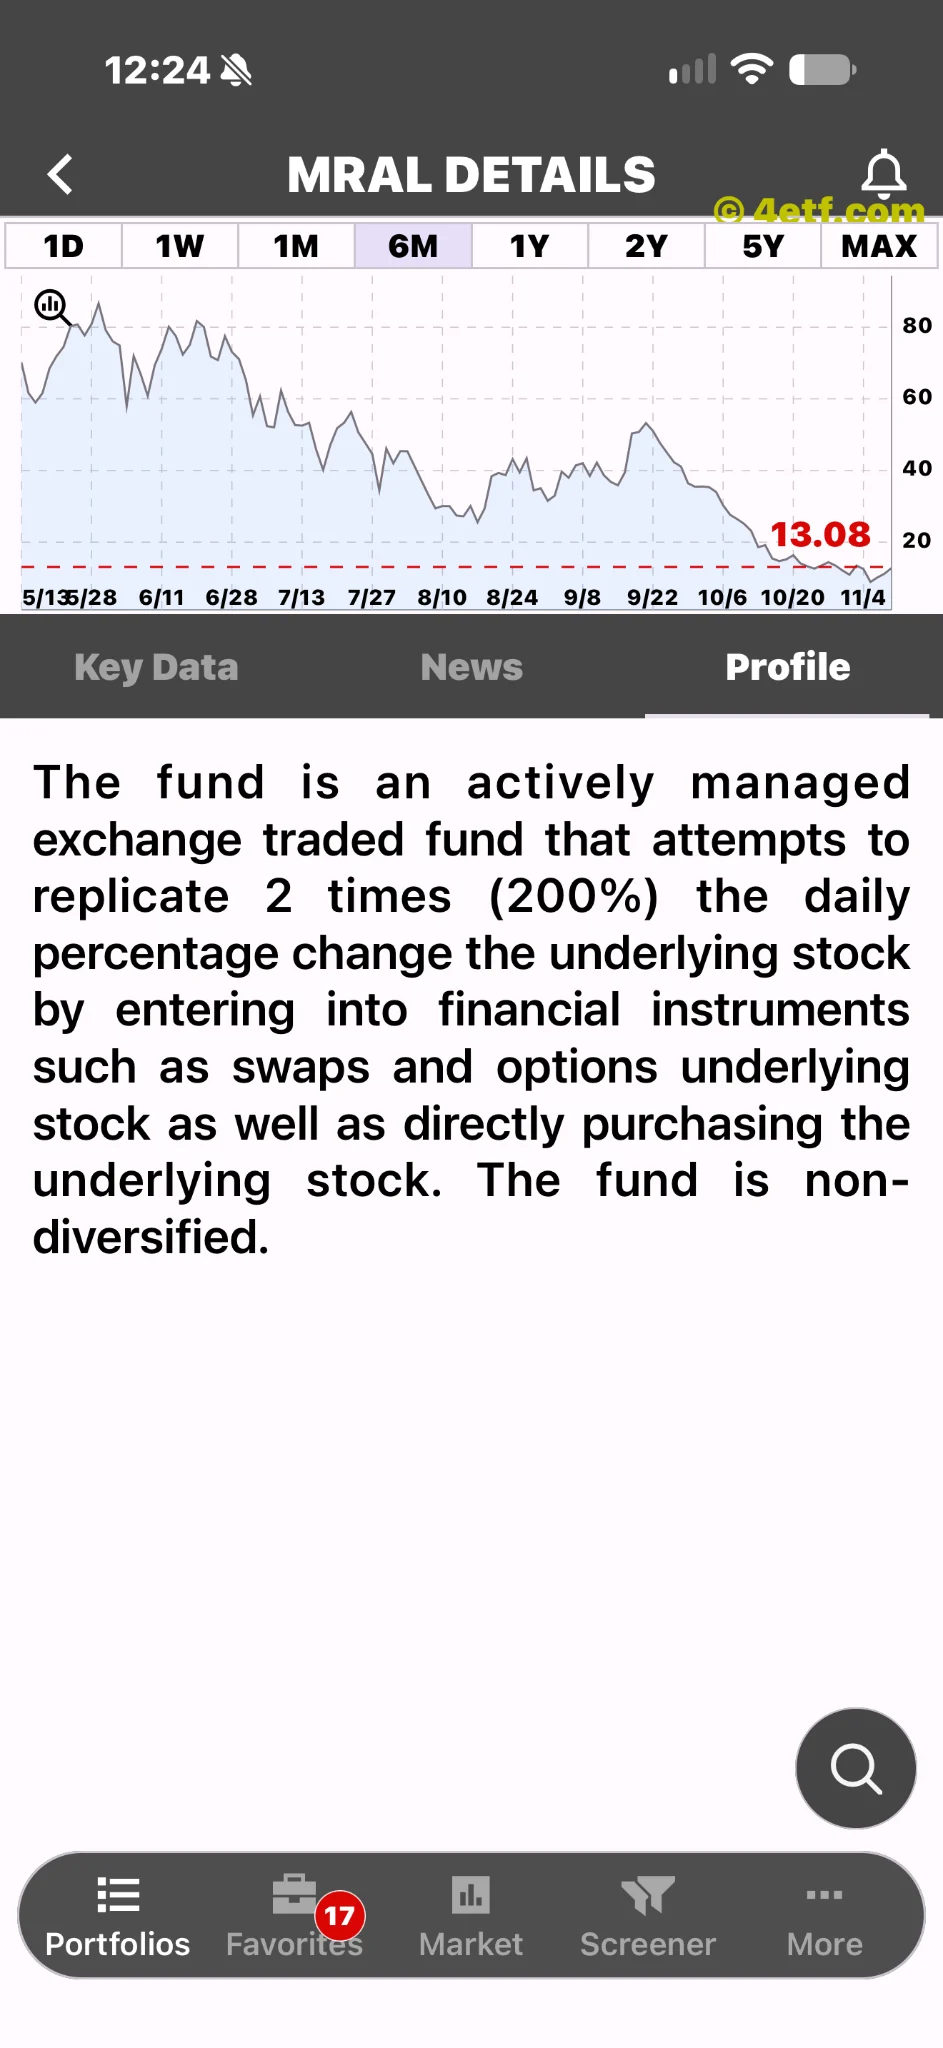
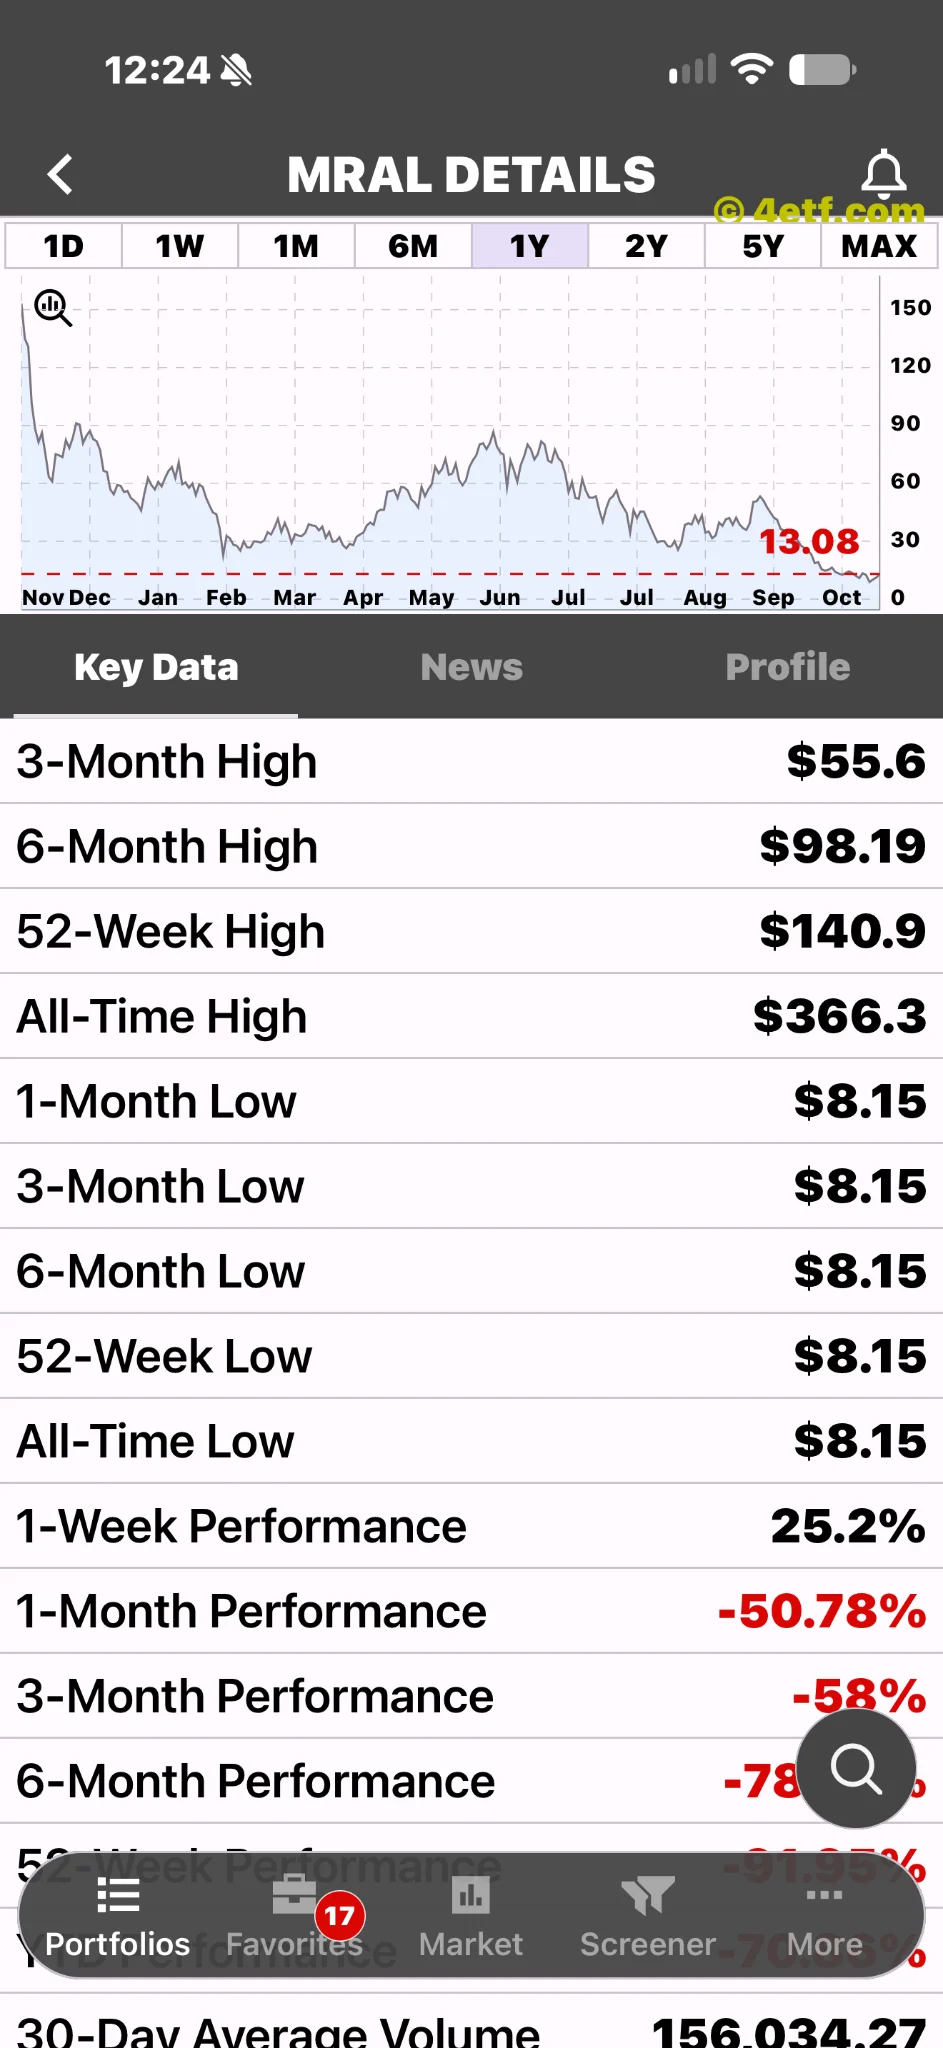
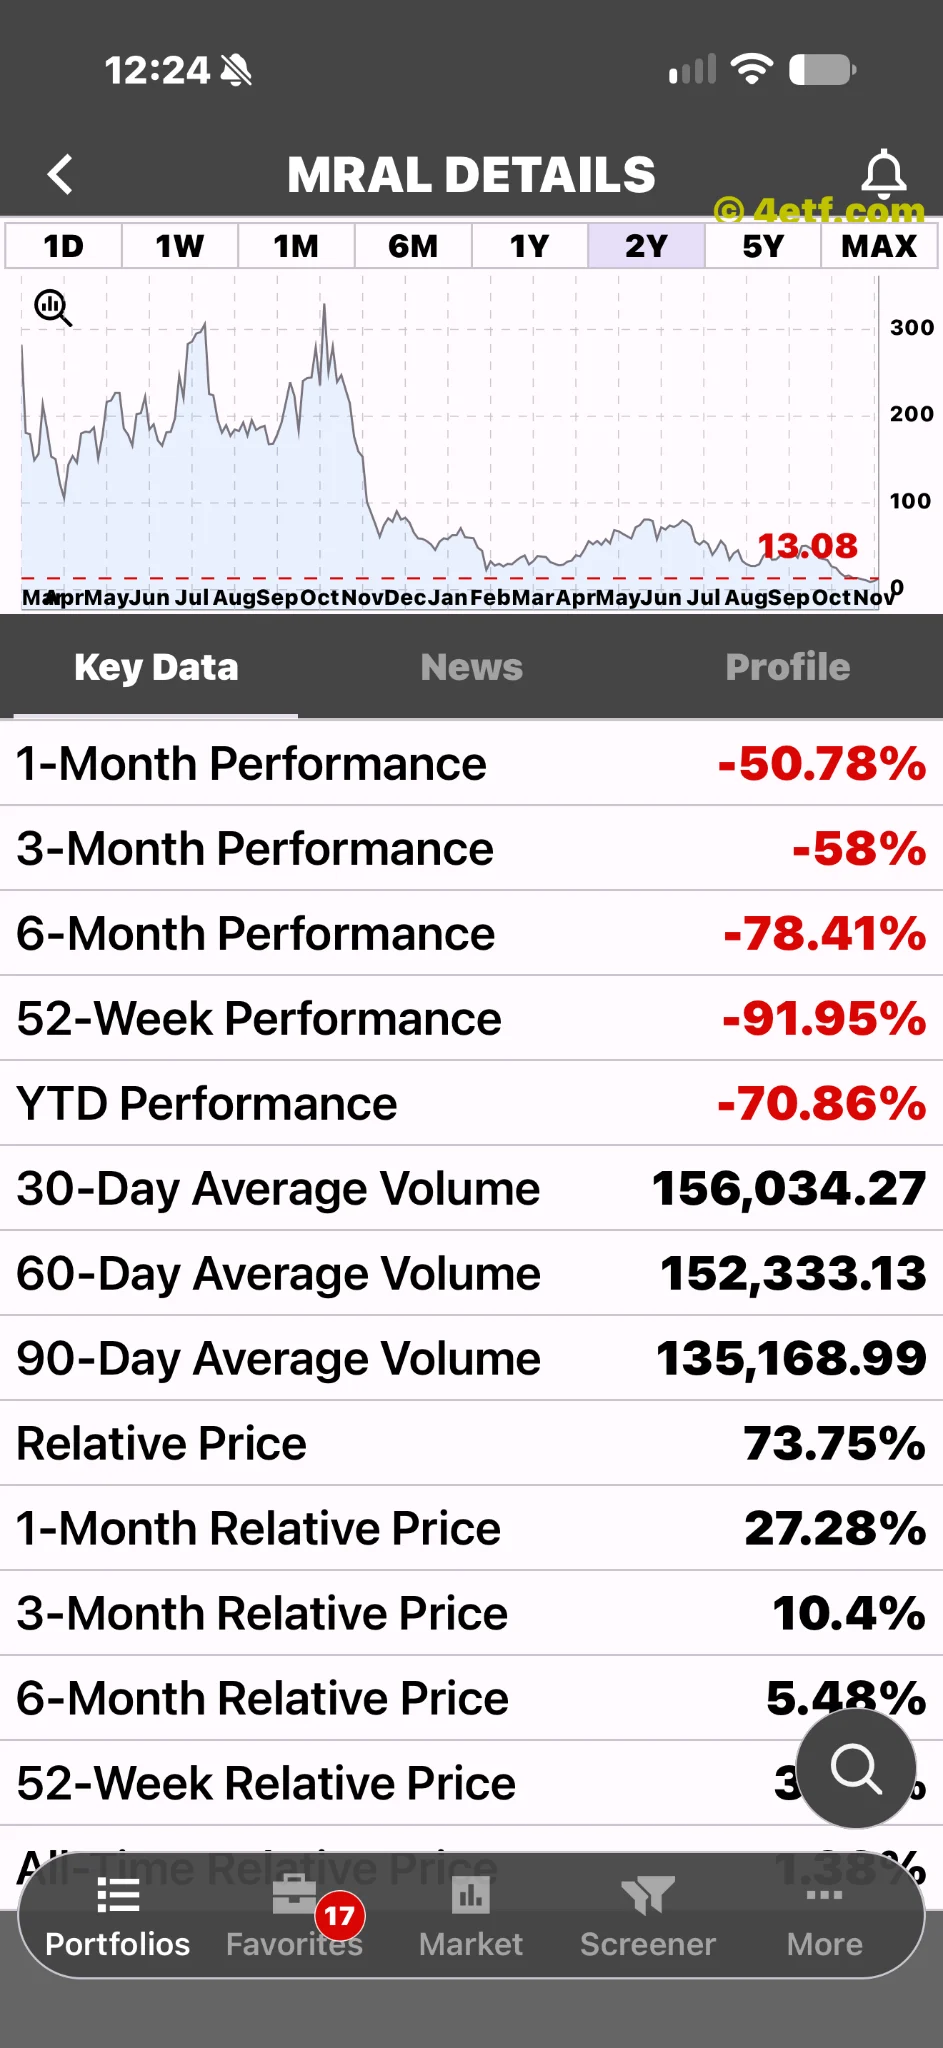
The supplied longer MHX view, with six months selected, displays trading from July into November and a pronounced decline before the latest rebound. It is a price-chart observation. The screenshot does not disclose adjustment methodology, so it should not be treated as an audited total-return record.
Daily leverage also changes the holding-period calculation. In a hypothetical two-day example, a stock rising 10% and then falling 9.09% returns approximately to its starting value. A perfect 2× daily product moves from 100 to 120 and then to about 98.18, before fees. The path matters even when the underlying finishes nearly unchanged.
The next useful tests are actual repurchases, signed leases and operating results that support the valuation without relying on bitcoin marks. For the ETF trade, the immediate tests are simpler: a fresh quote, a usable spread and an understood holding period. A large green percentage answers none of those questions by itself.