The biggest number on a gainers screen does not always identify a flourishing business. AXTQ is designed to profit when AXT’s stock falls. That distinction turns its prominent green reading into a story about a semiconductor supplier under pressure, rather than a new endorsement of the supplier’s prospects.
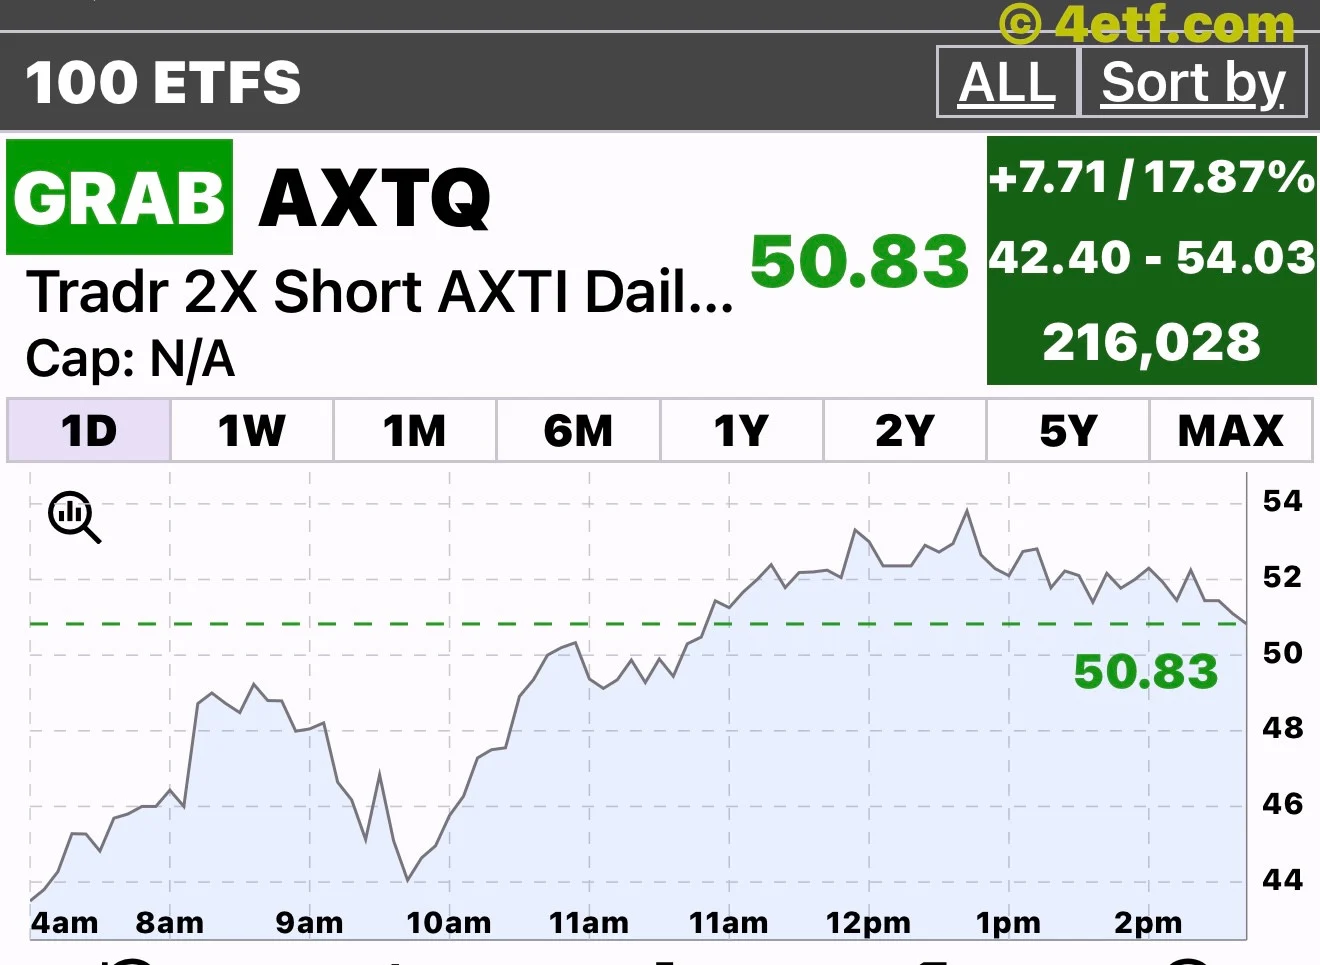
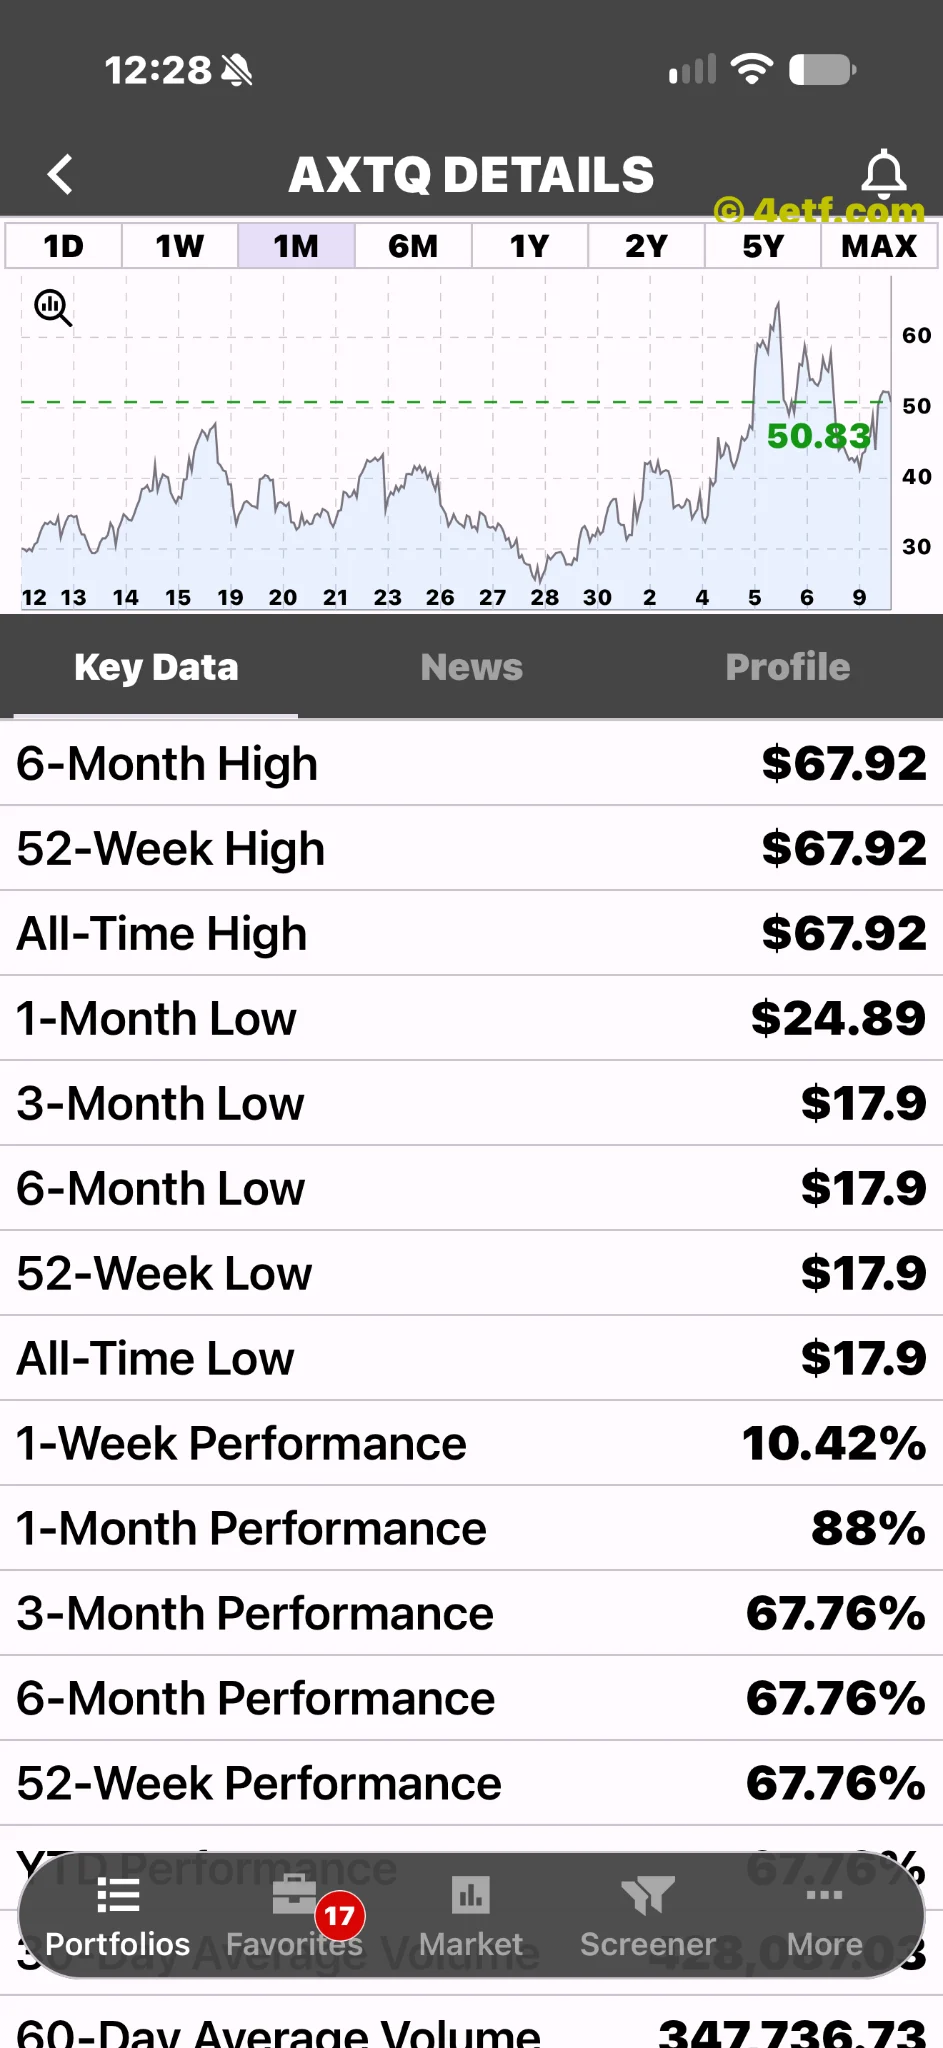
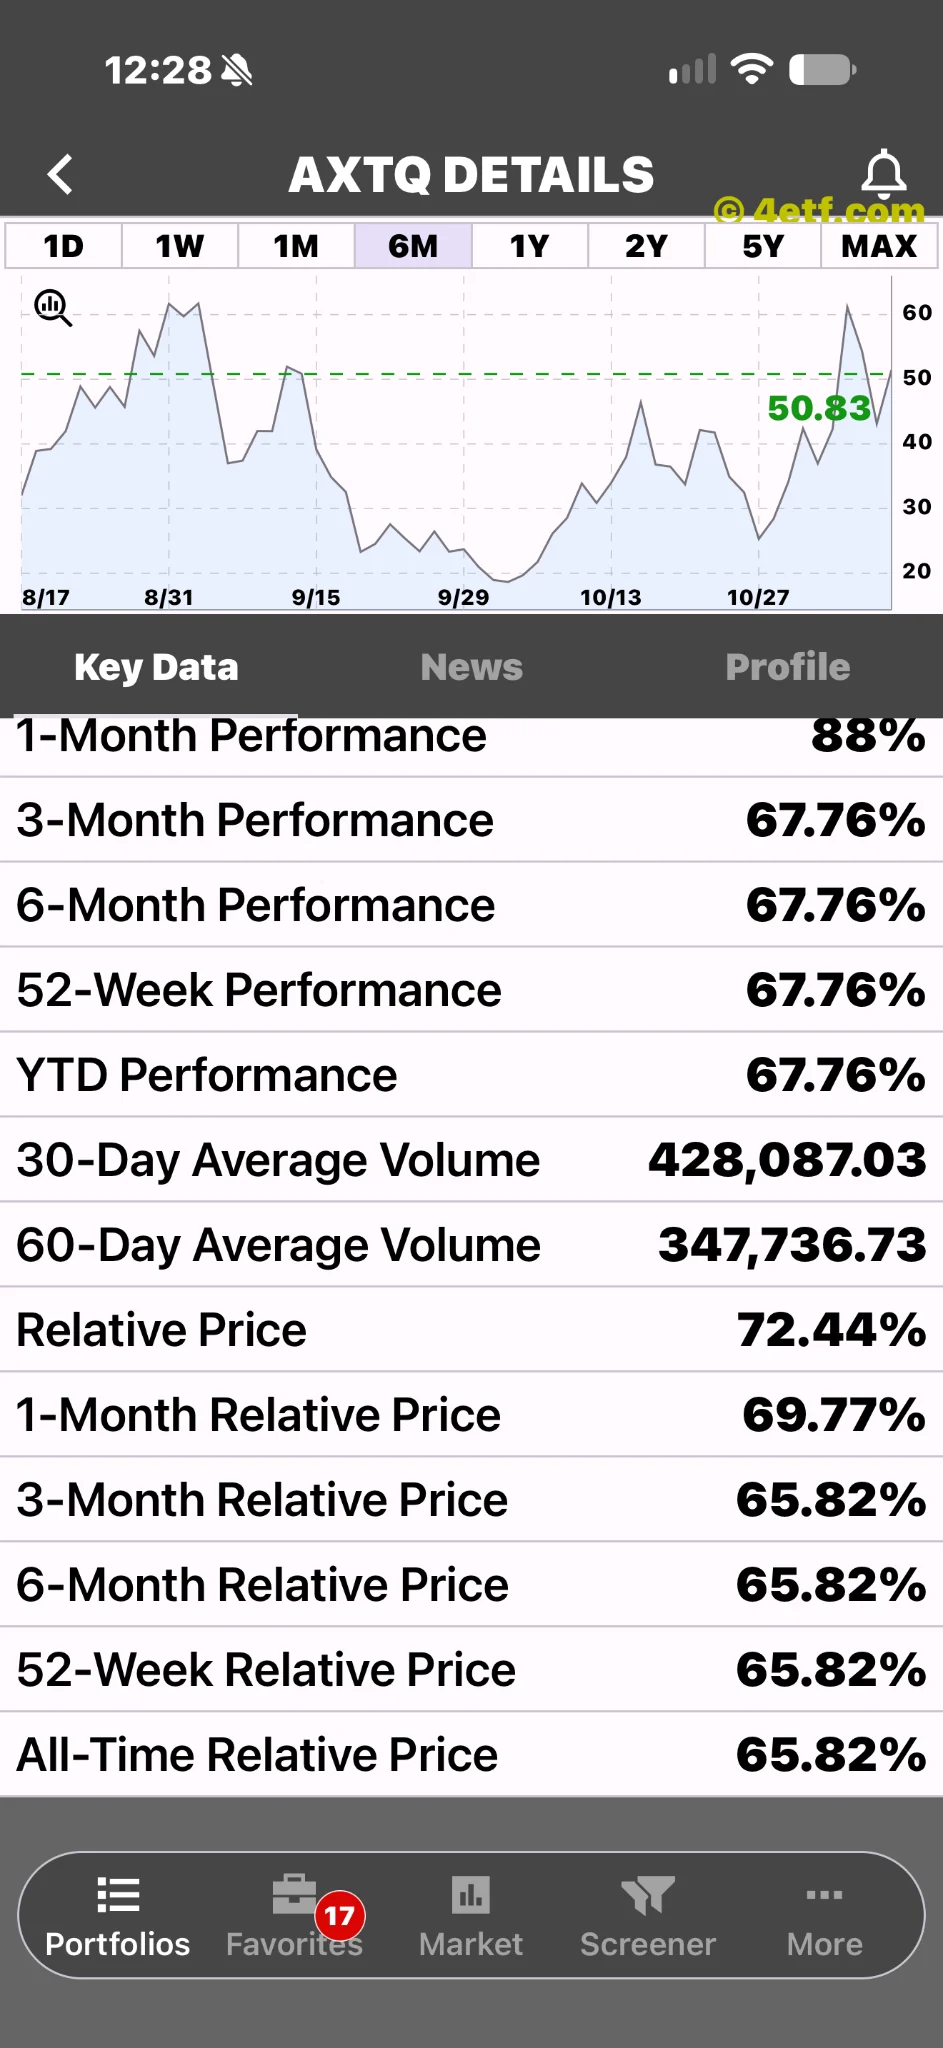
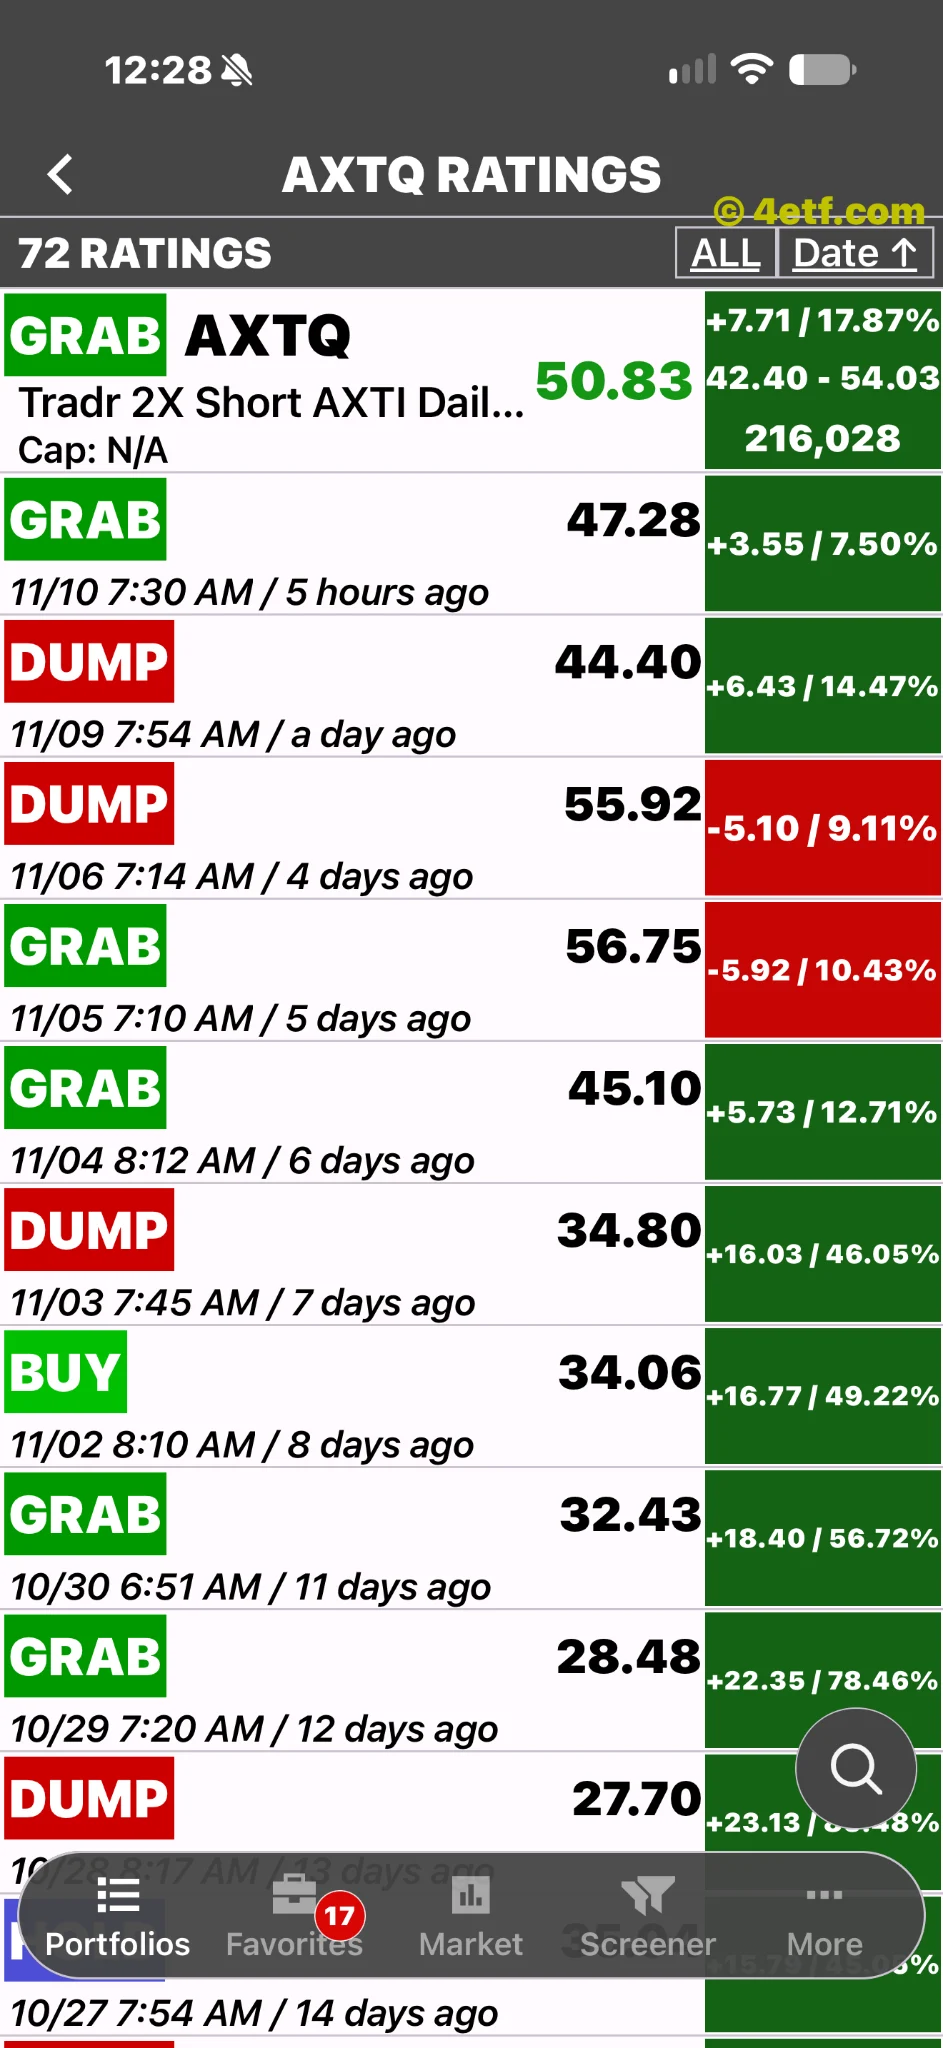
The supplied 4etf.com one-day chart displays AXTQ at $50.83 with a gain of 17.87%, after the earlier gainers list showed $51.44 and 19.29%. The later image gives a $42.40 to $54.03 range and volume of 216,028 shares. These are image observations. The screenshot does not establish the exchange timestamp or confirm that the percentage is the final regular-session return. The analysis concerns U.S. trading on November 10, 2026.
A falling stock can produce a rising fund
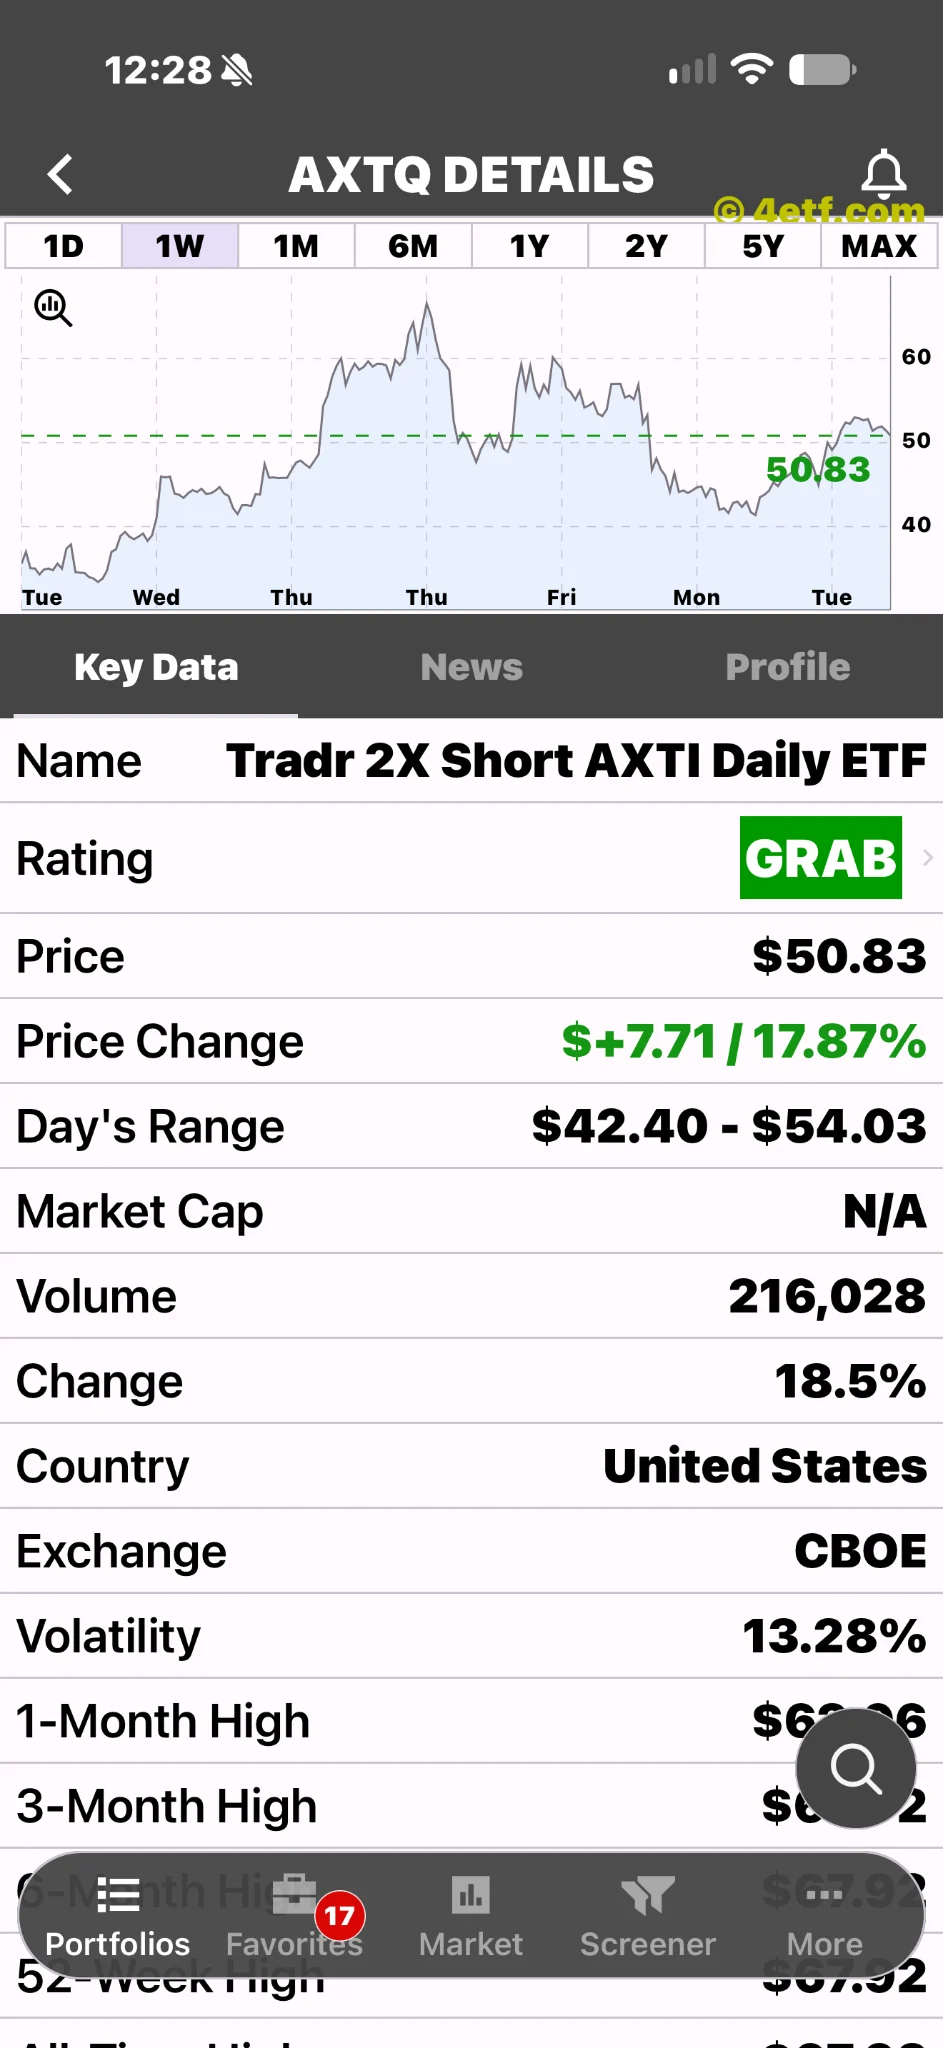
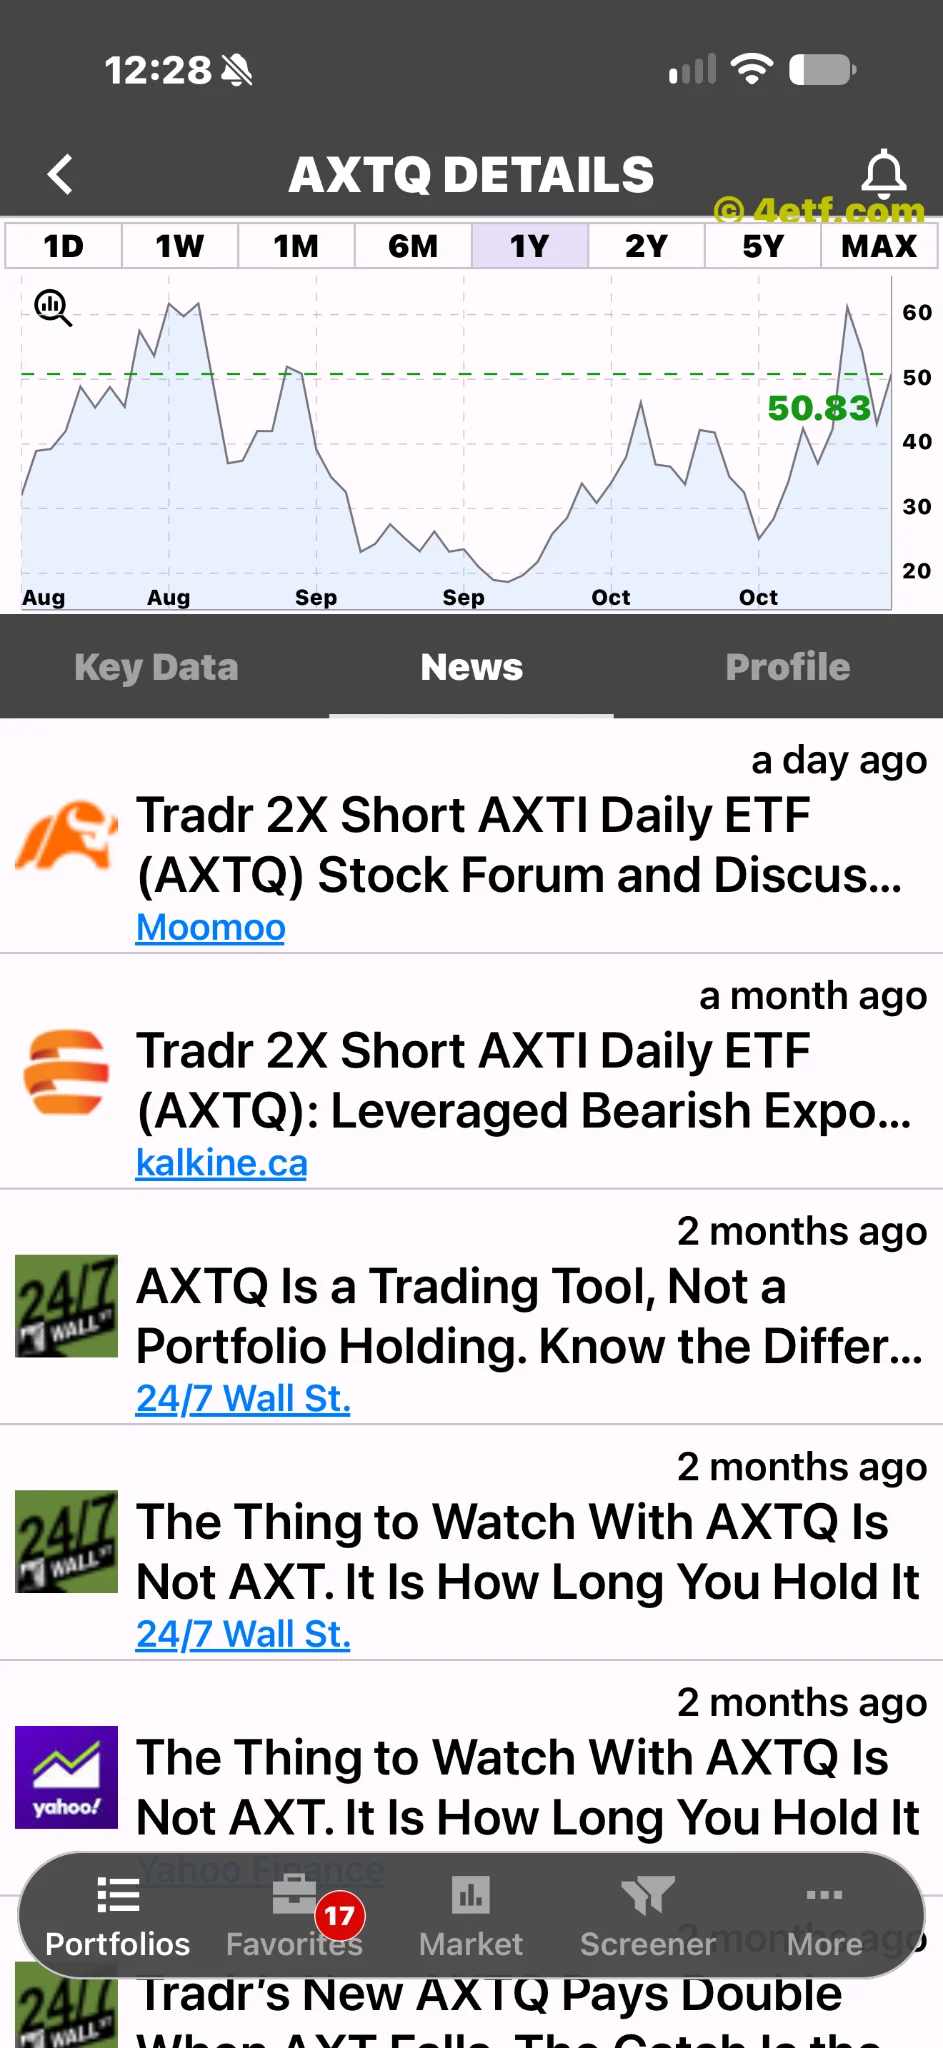
Tradr’s product page says AXTQ seeks twice the inverse daily performance of AXT common shares before fees and expenses. AXTI is the company’s stock symbol; AXTQ is the leveraged bearish fund. Confusing those names reverses the meaning of the trade.
A timestamped ChartExchange observation shows AXTI at $38.46, down 10.37%, at 2:30:58 p.m. Eastern on November 10, versus a $42.91 prior close. That timestamped observation confirms substantial weakness in the reference stock. It is not a quote synchronized to the user’s screenshot, and therefore is not an exact explanation of either displayed fund percentage.
The mechanism is straightforward even when the timestamps are not. A hypothetical 10% daily decline in AXTI would imply a 20% target gain for a perfect minus-2× product before costs. A 10% rise would instead imply a 20% target loss. Buying the fund after it has already risen does not entitle the buyer to the gain already displayed.
A market explanation is not a company announcement
The Bureau of Labor Statistics reported that October consumer prices rose 0.4% from the prior month on a seasonally adjusted basis. Reuters described a broad November 10 stock-market decline as inflation data pushed yields higher and increased concern about further rate increases. That provides relevant market context for a volatile technology stock.
It does not prove that inflation alone caused AXT’s drop. We did not verify a separate AXT announcement on November 10 that explains the move. Claims that a new order vanished, a customer defected or an earnings warning appeared would go beyond the evidence gathered for this article.
The most recent verified quarterly release offers an important complication. On October 29, AXT reported record revenue of $73.4 million, up 162% year over year, and non-GAAP earnings of $0.41 per share. Management attributed the sales strength to demand for indium phosphide material. A falling stock price can coexist with growing reported sales; the price also reflects expectations and the risk investors will accept.
Yesterday’s rebound shows the reversal risk
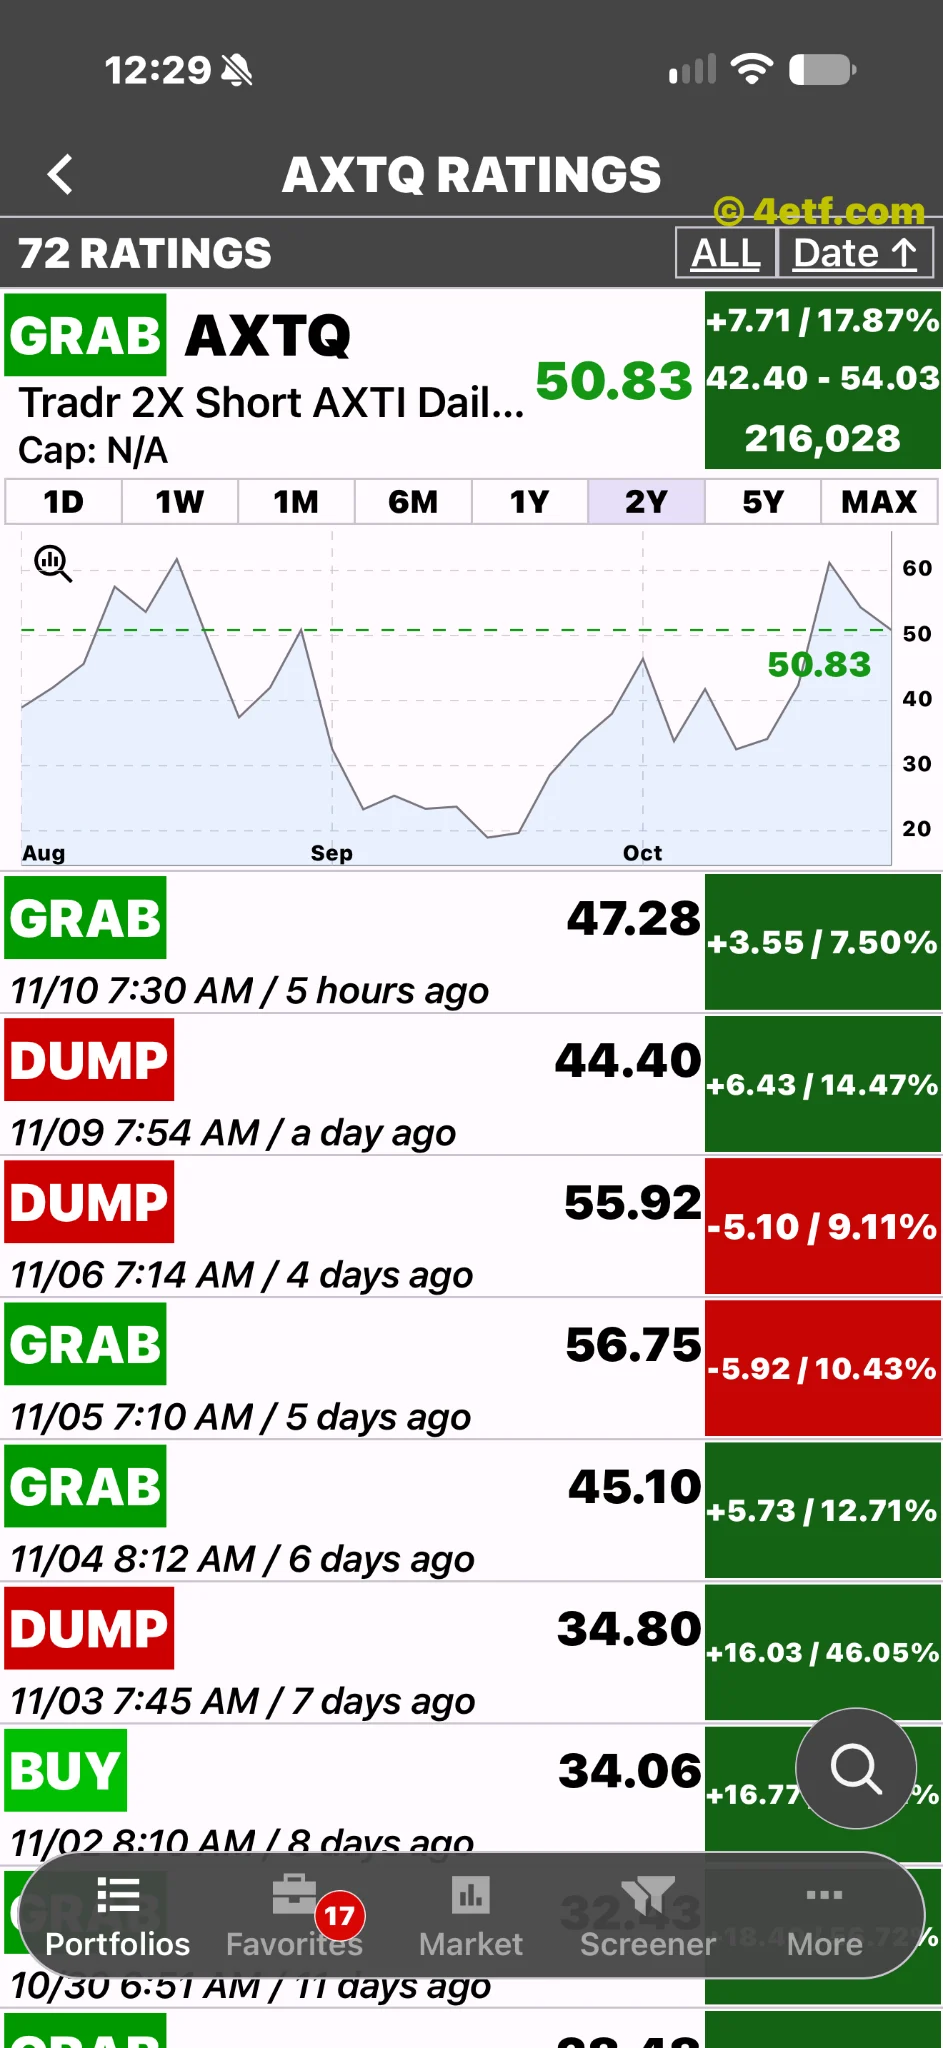
ChartExchange records AXTI rising 10.37% on November 9 before the next session’s decline. That sequence matters for anyone tempted to read AXTQ’s current leaderboard position as a persistent trend. The underlying has been moving sharply in both directions.
Daily resetting makes the path consequential. Consider a hypothetical stock that rises 10% and then falls 9.09%, ending nearly flat. A perfect minus-2× daily product would fall from 100 to 80, then rise to about 94.55. It would lose roughly 5.45% before fees despite little net movement in the stock. The example illustrates compounding; it does not estimate AXTQ’s actual two-day performance.
Our conclusion is narrower than a buy or sell call. The inverse design explains why AXTQ can surge while AXTI weakens. It does not establish a new deterioration in AXT’s business or make the next day predictable. The next useful evidence is a fresh company disclosure, followed by a same-time comparison of the fund, the stock and the available bid-offer spread.