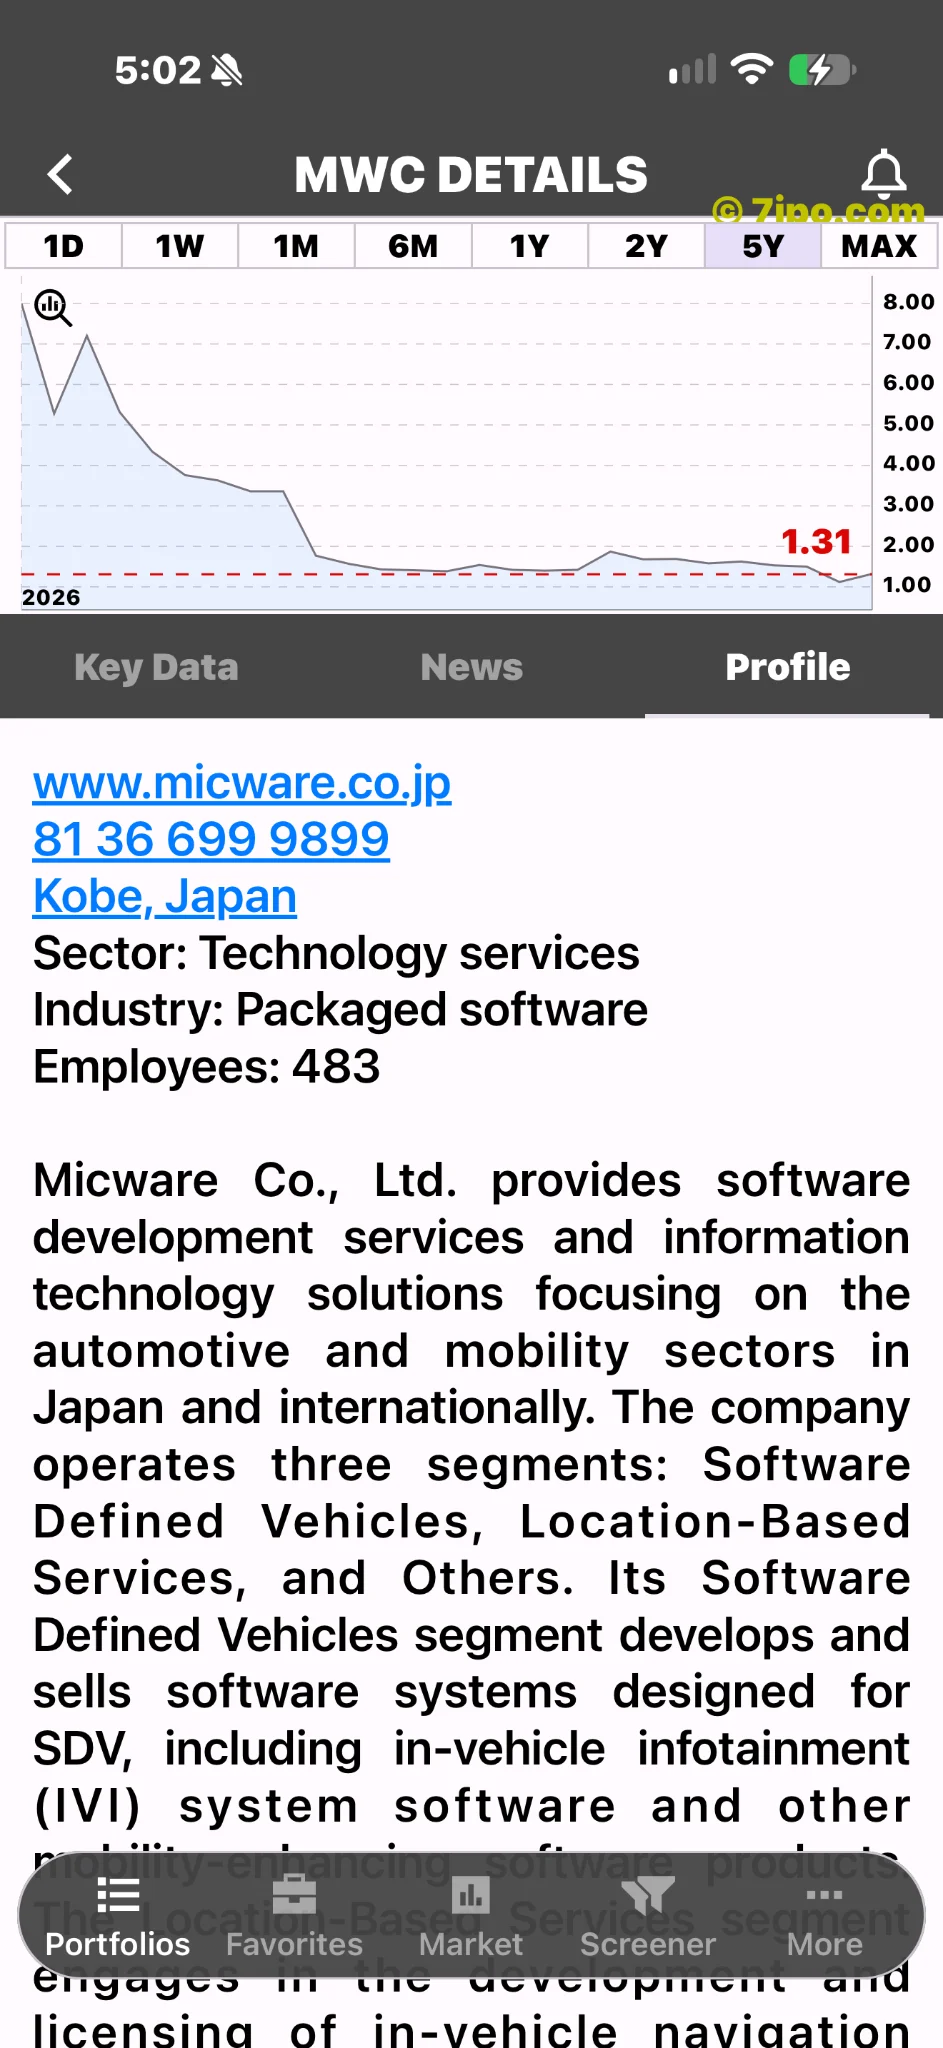
Micware (Nasdaq: MWC) develops automotive and mobility software. Its scale: ¥10.61 billion in revenue for the six months ended August 31, 2026, and 483 full-time employees at February 28, 2026. The revenue and headcount cover different reporting dates. Half-year results; 2026 annual report.
The margin story is stronger than the bottom line
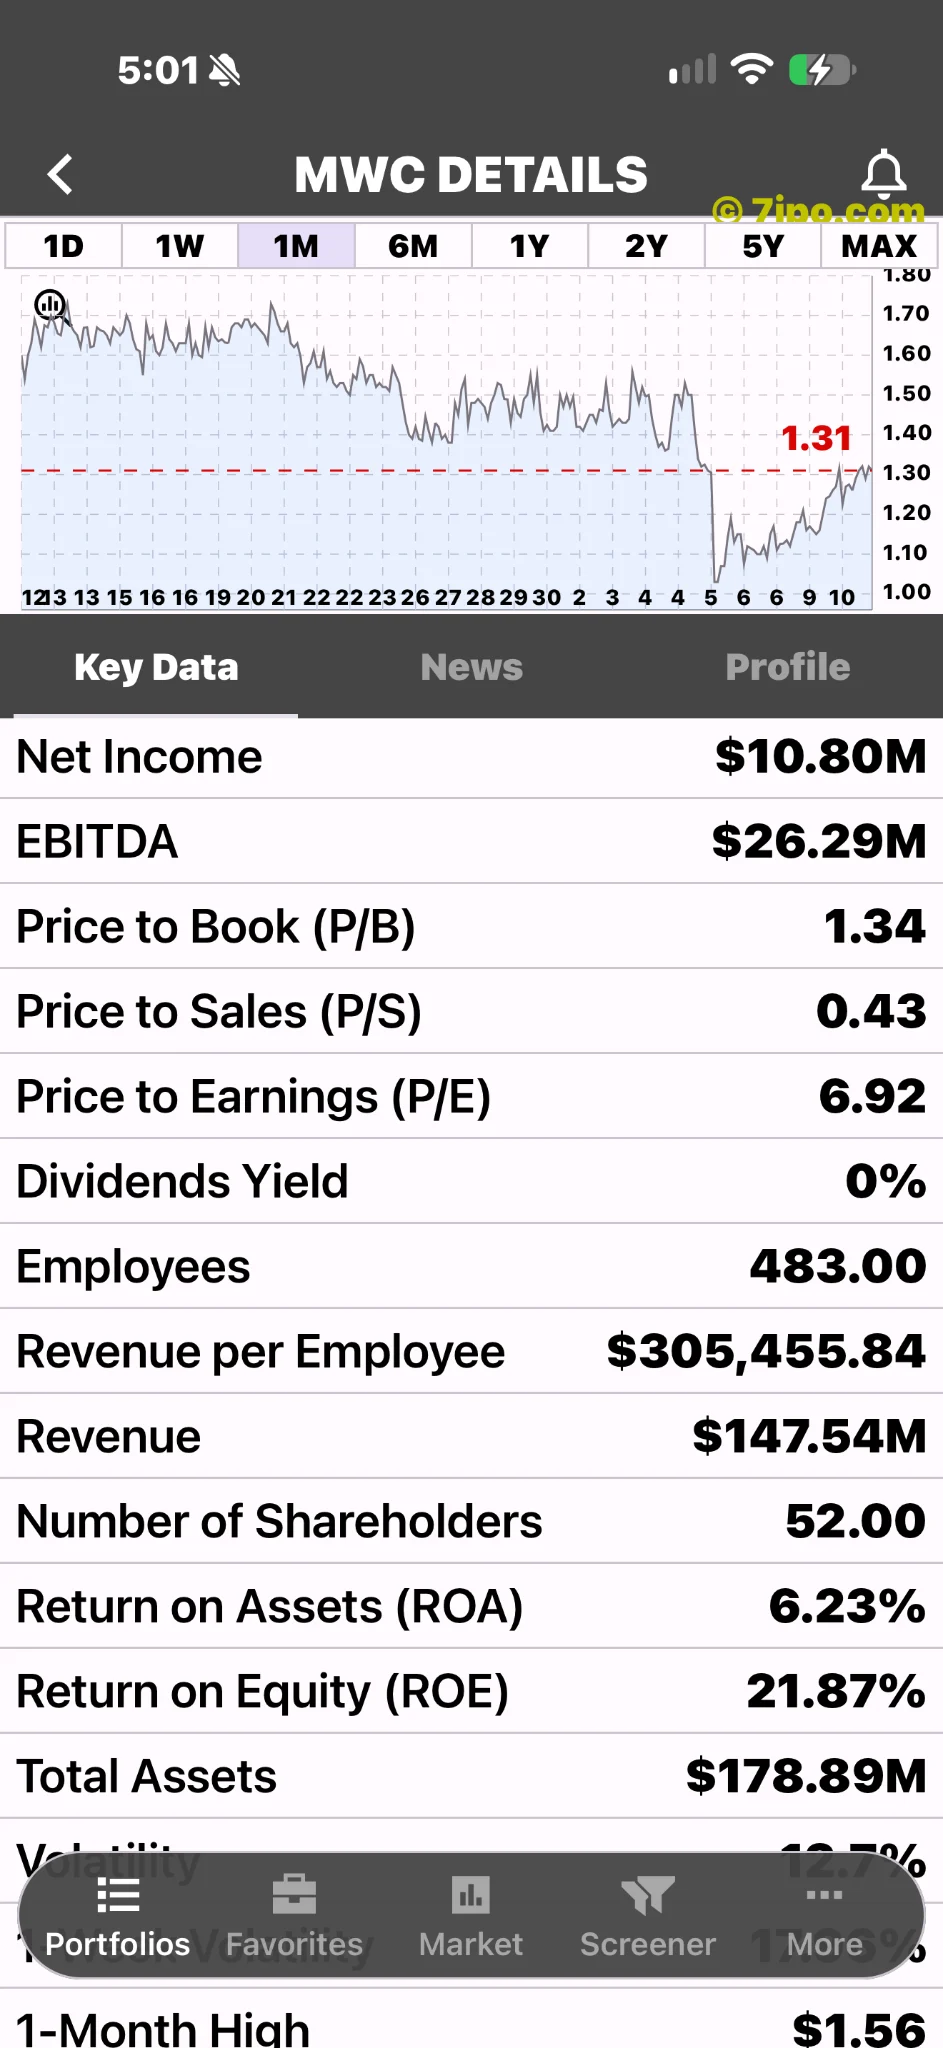
The November 10 results showed yen revenue rising 3.4% and gross margin reaching 36.3%, versus 31.4%. Yet operating profit rose only 0.5%, while net income fell to ¥612.9 million from ¥708.8 million. Management cited share-based compensation and increased research spending as operating-profit constraints. Company results.
That is the interesting tension: better economics on work delivered do not automatically become stronger earnings for shareholders. The next test is whether the improved margin survives while development spending produces commercially useful products. A margin recovery deserves attention; a durable earnings recovery requires more evidence.
A rebound is not a reset
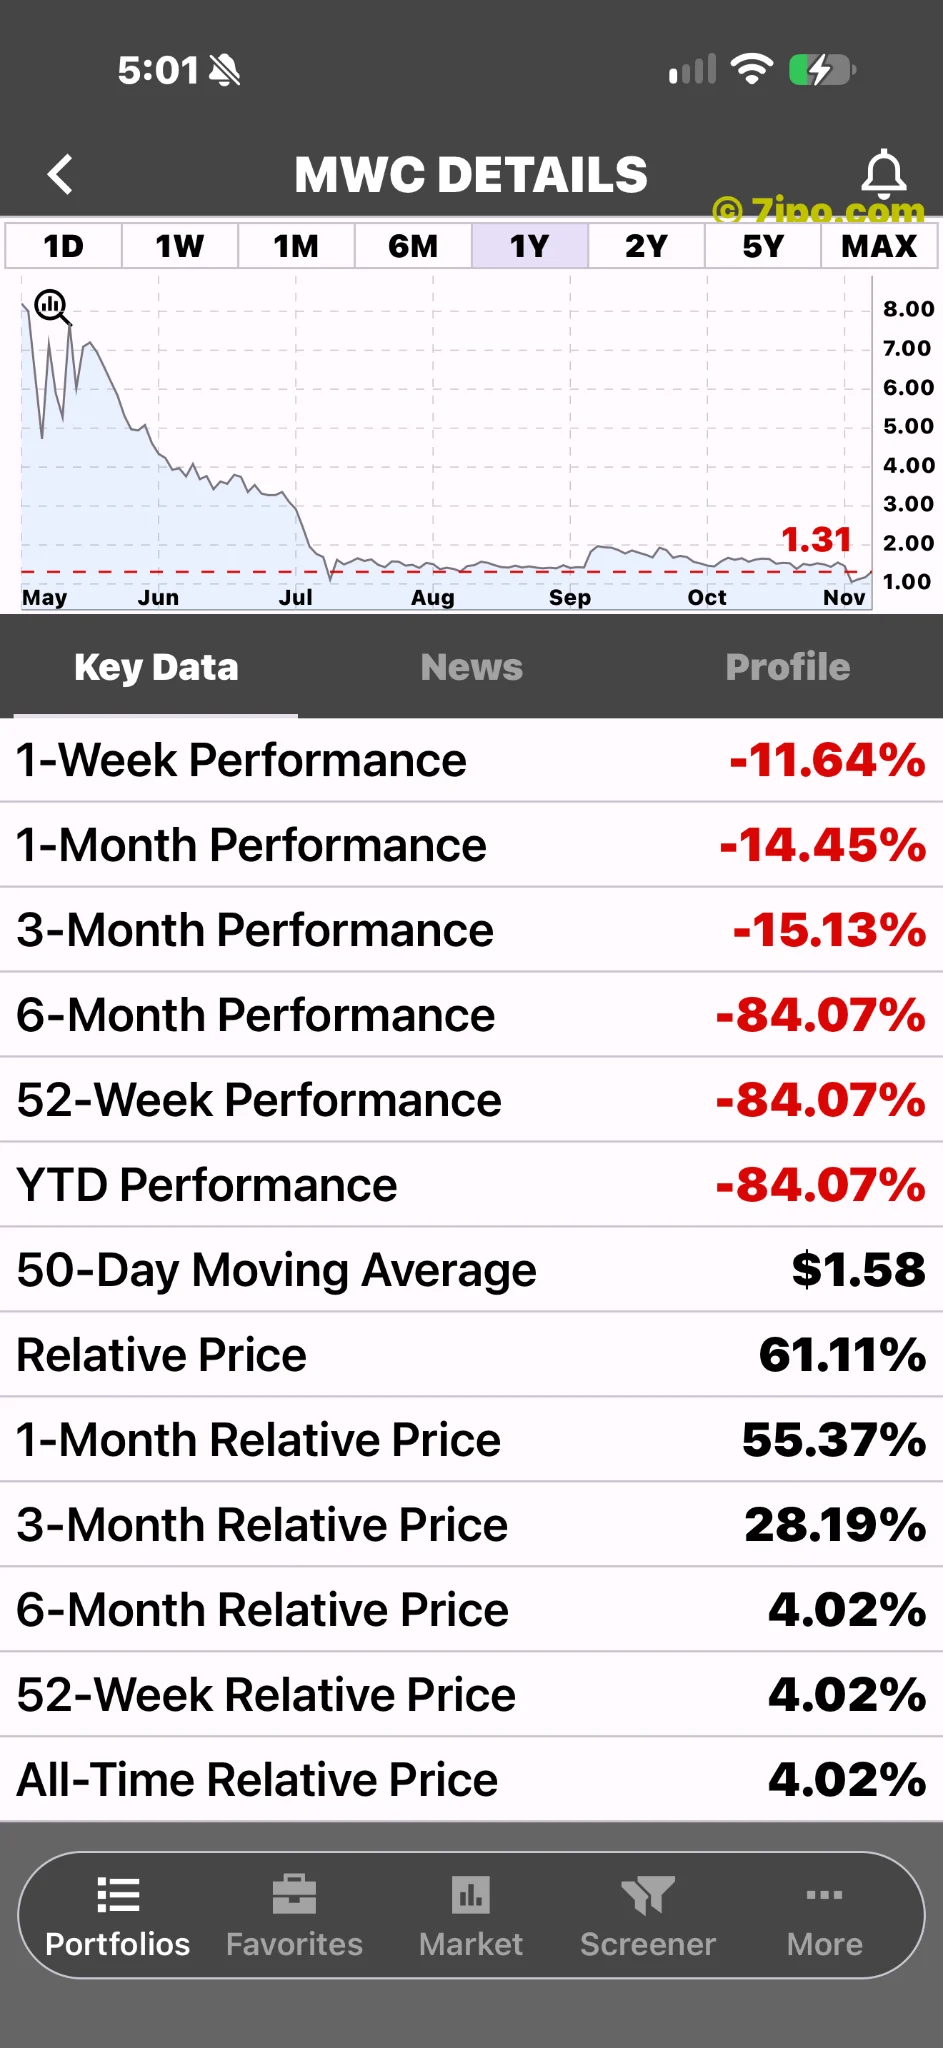
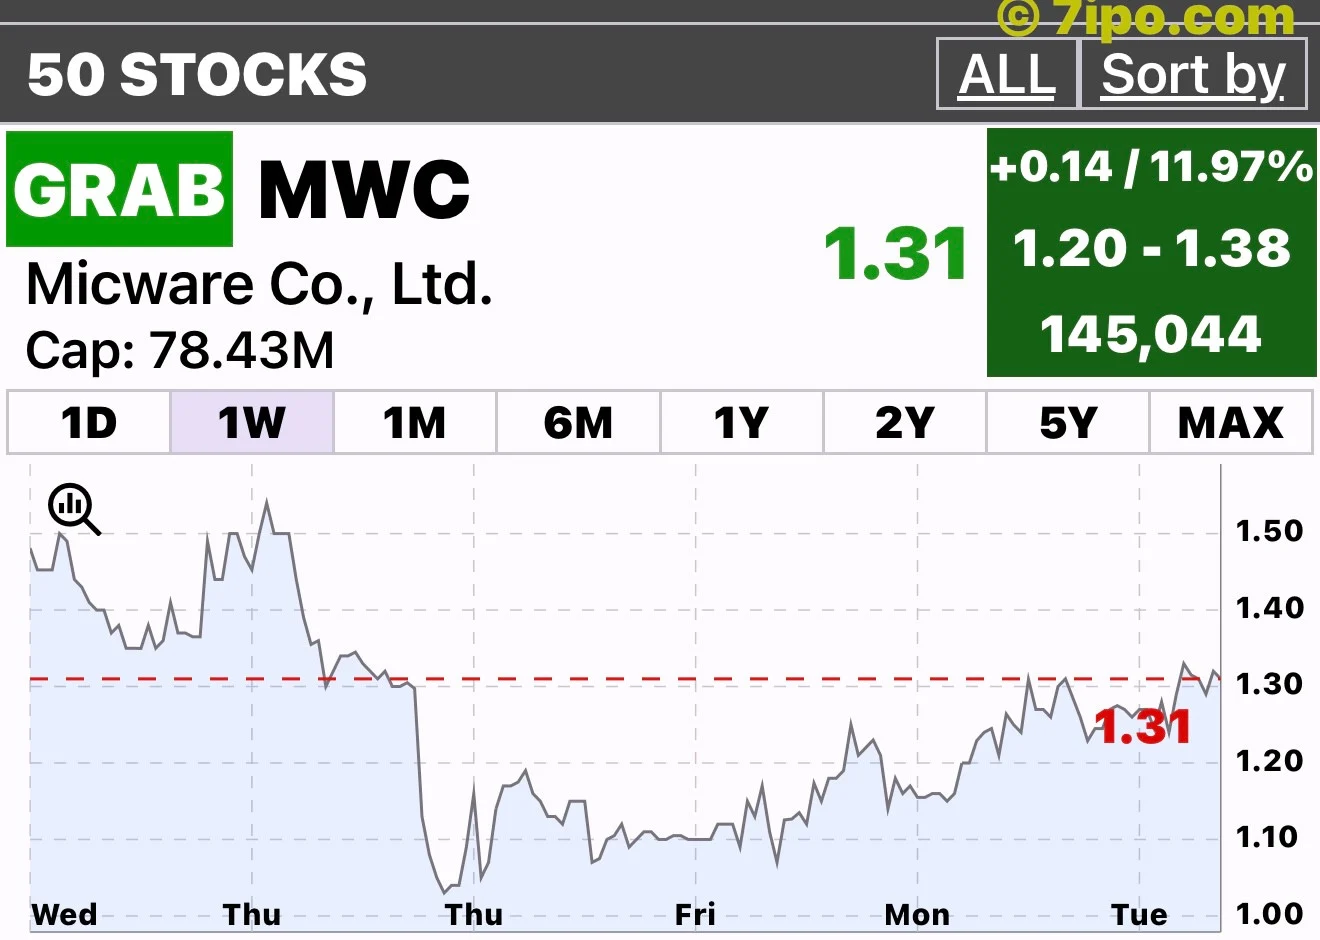
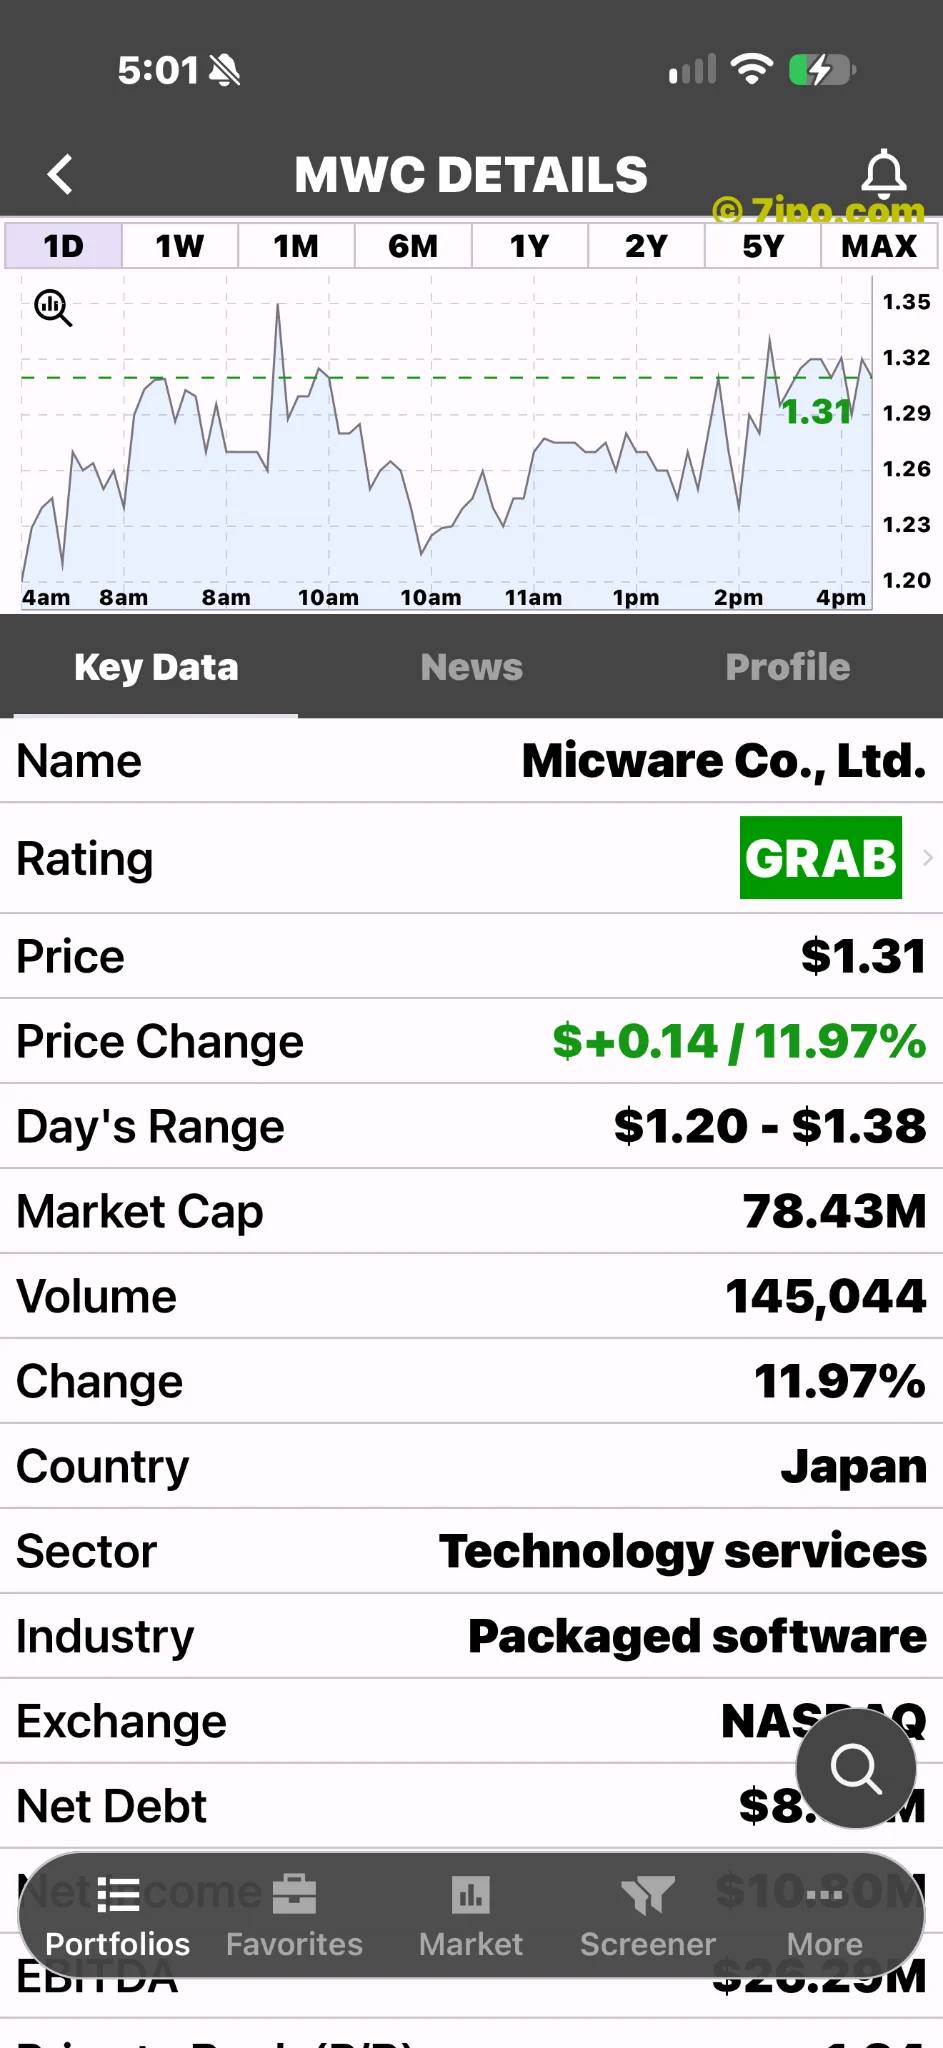
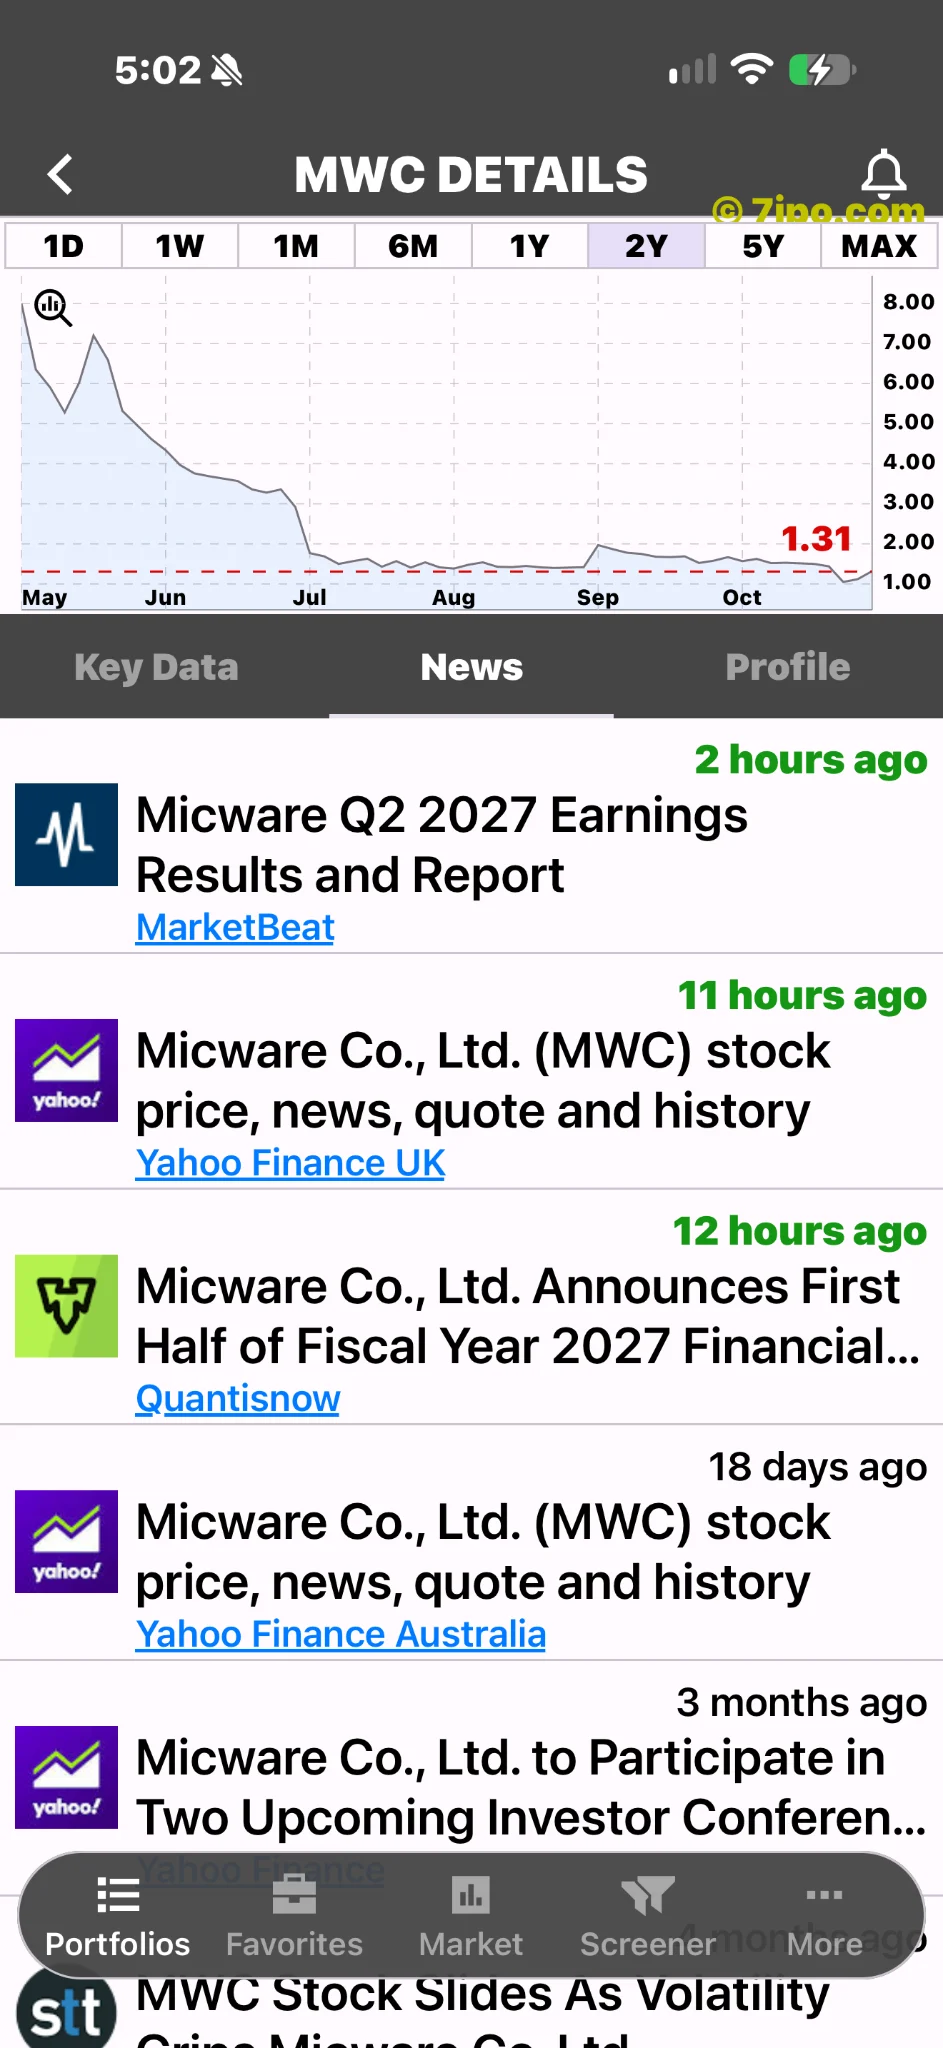
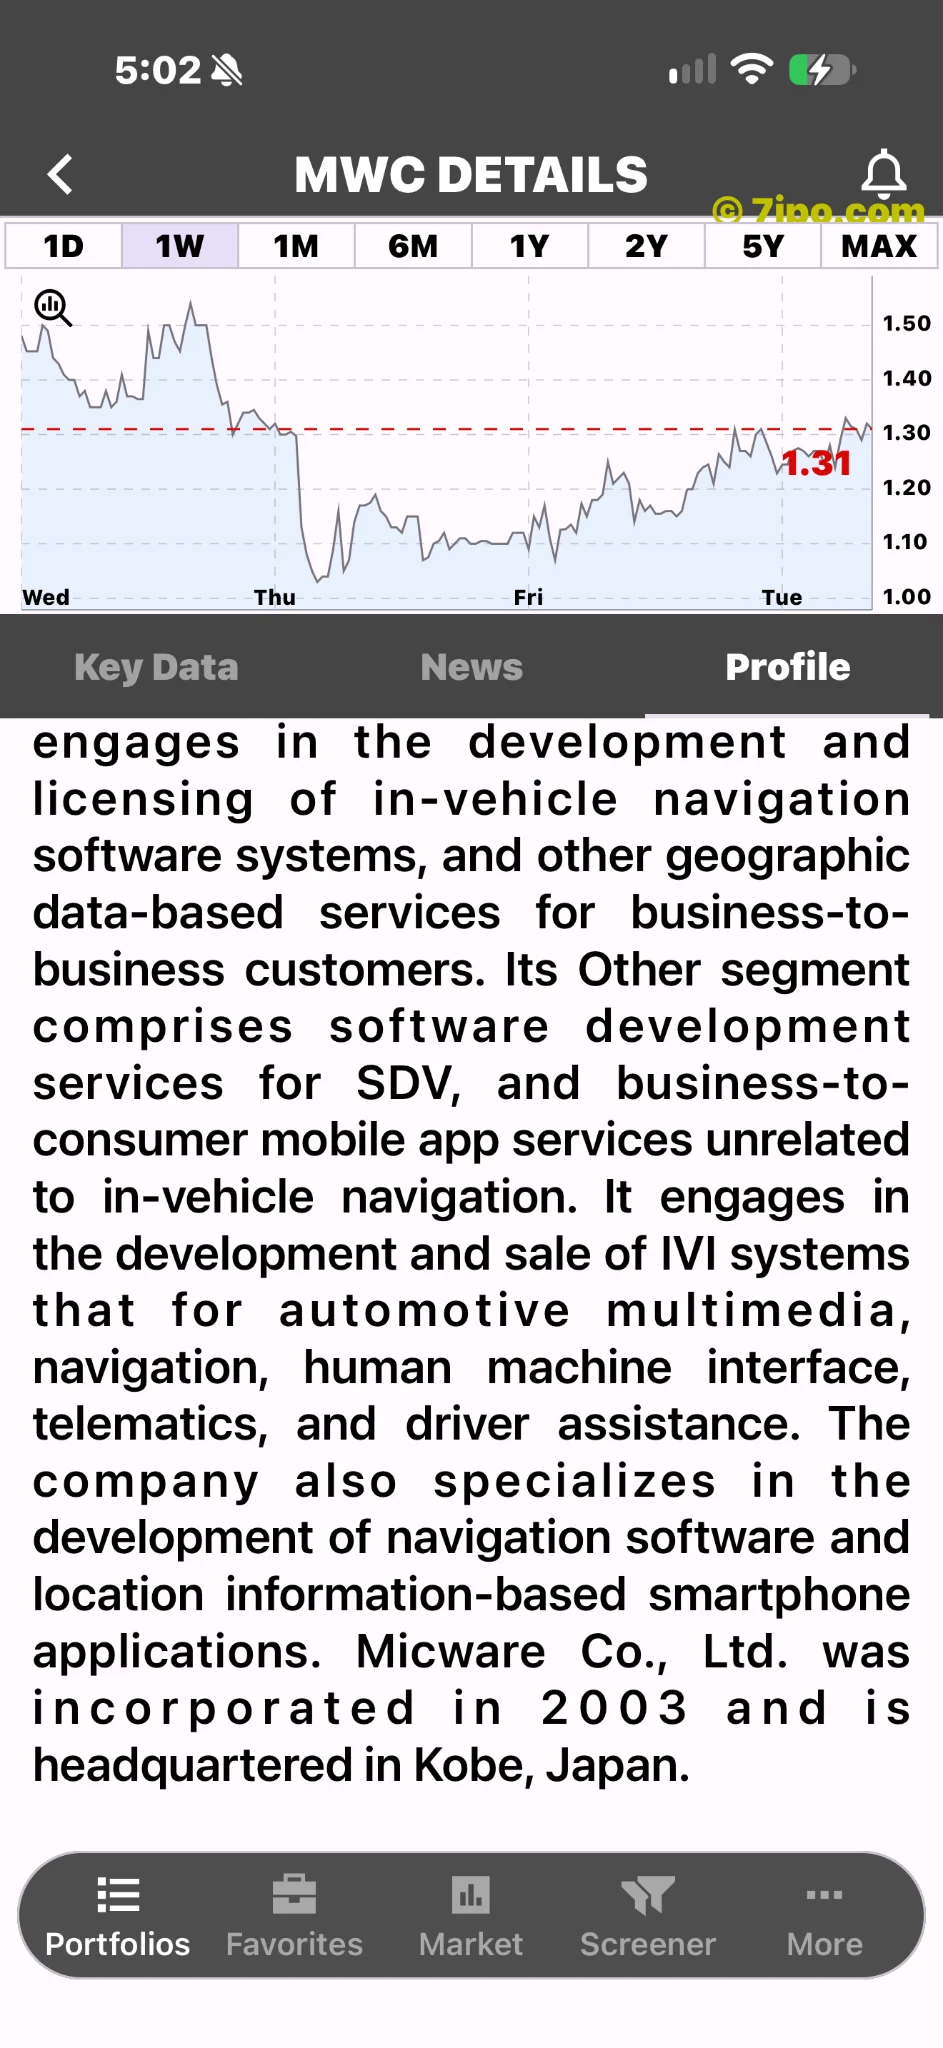
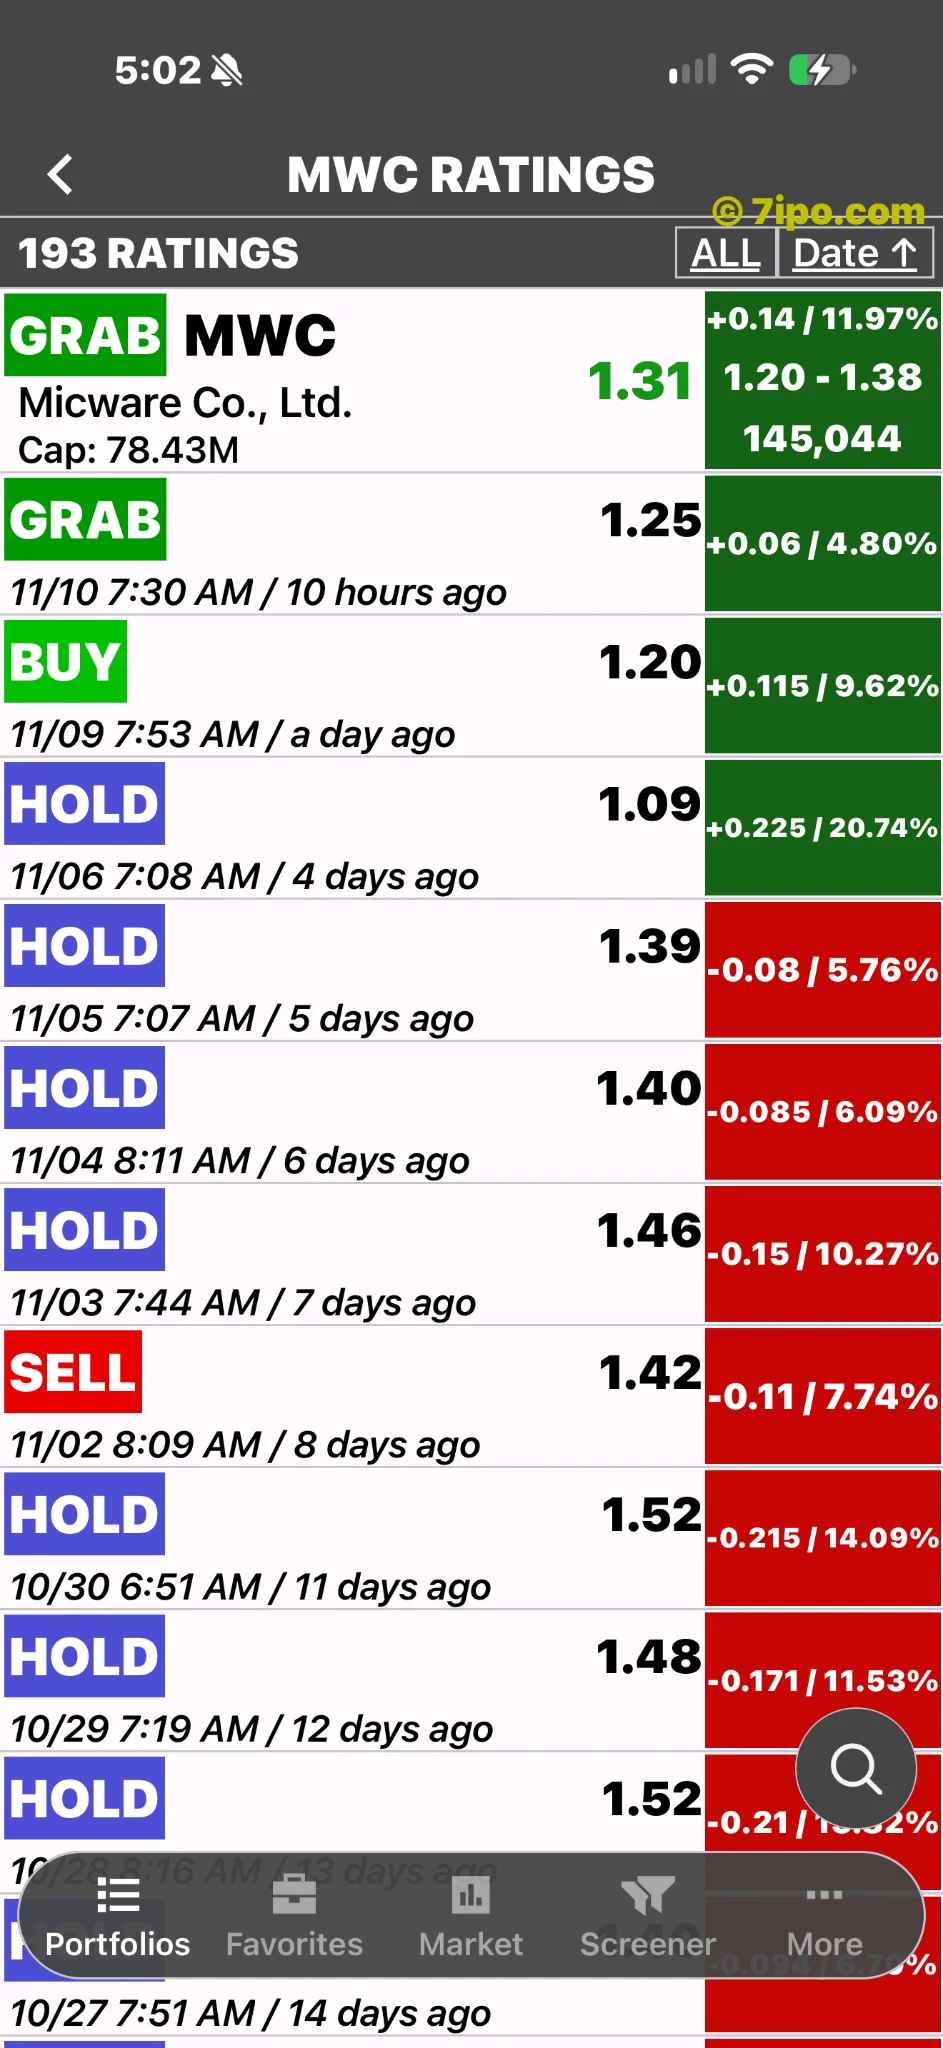
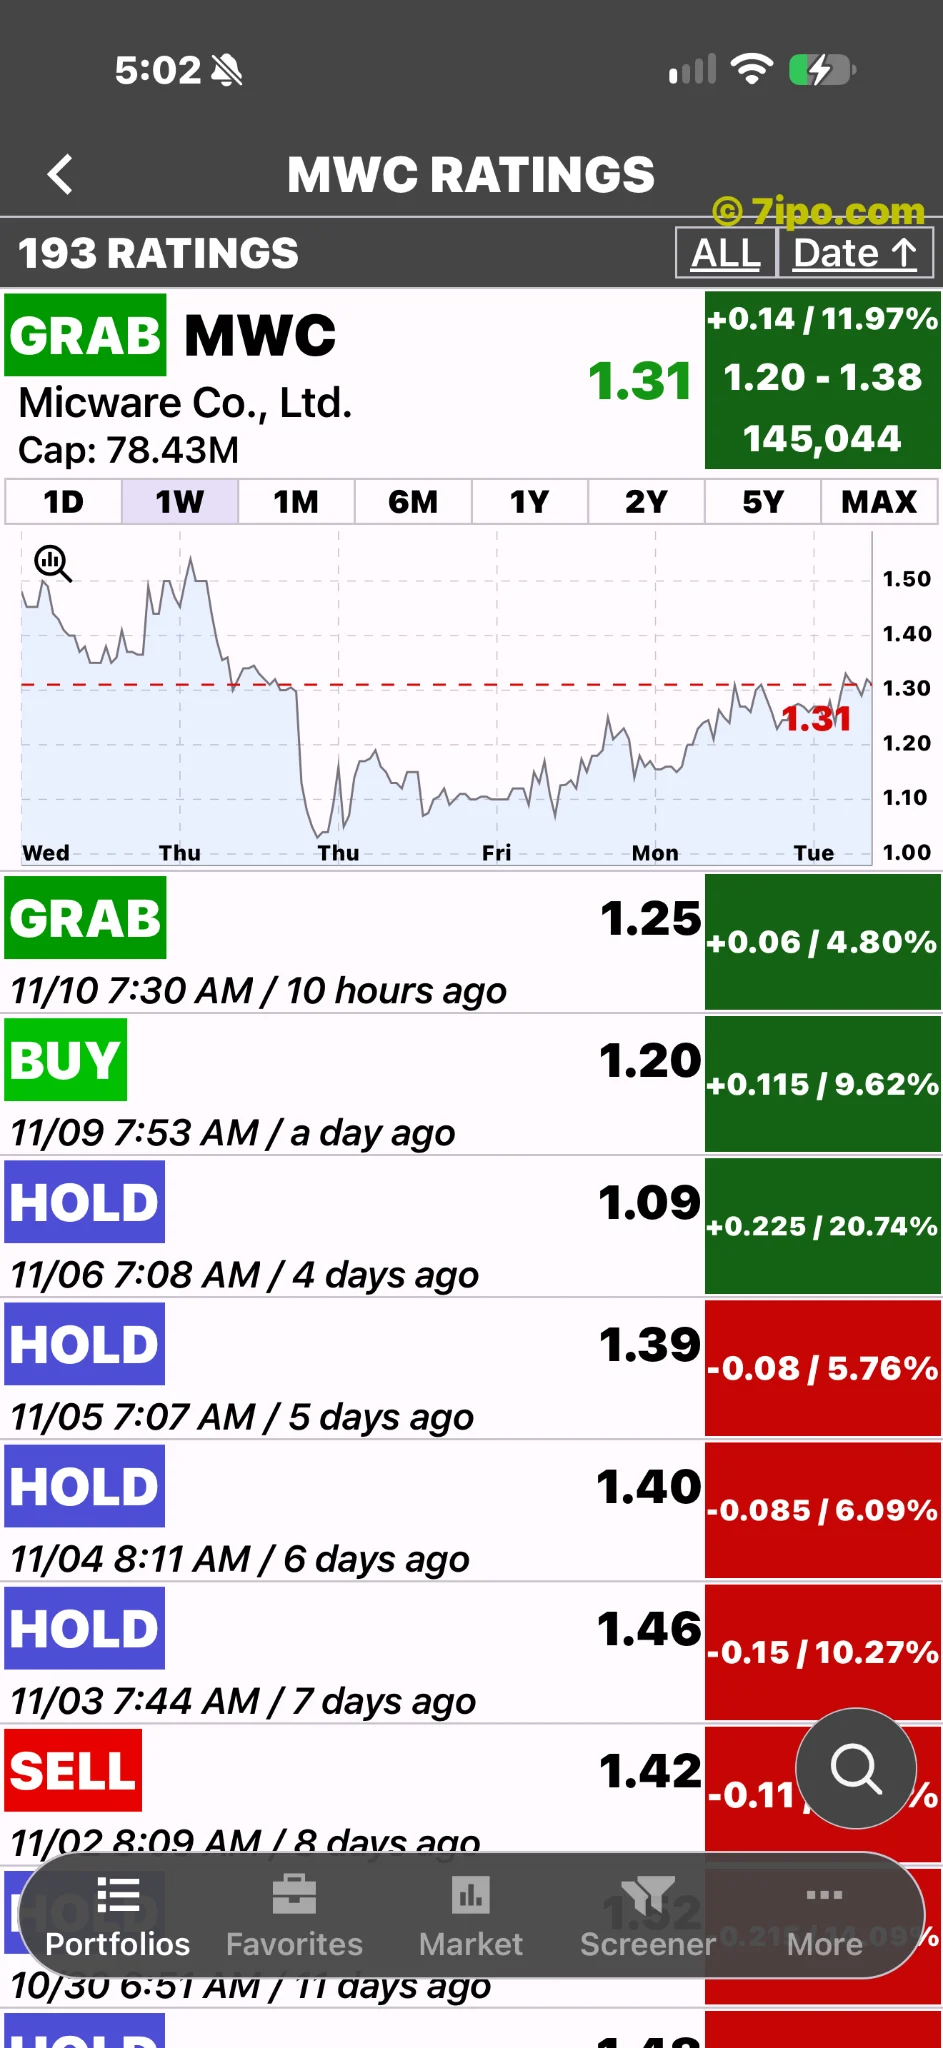
The supplied chart shows $1.31 and a positive 11.97% header change. Its capture date, timezone and closing status are not established. The selected 1W view does not establish a one-week return, and the results announcement cannot be confirmed as the cause of this displayed move.
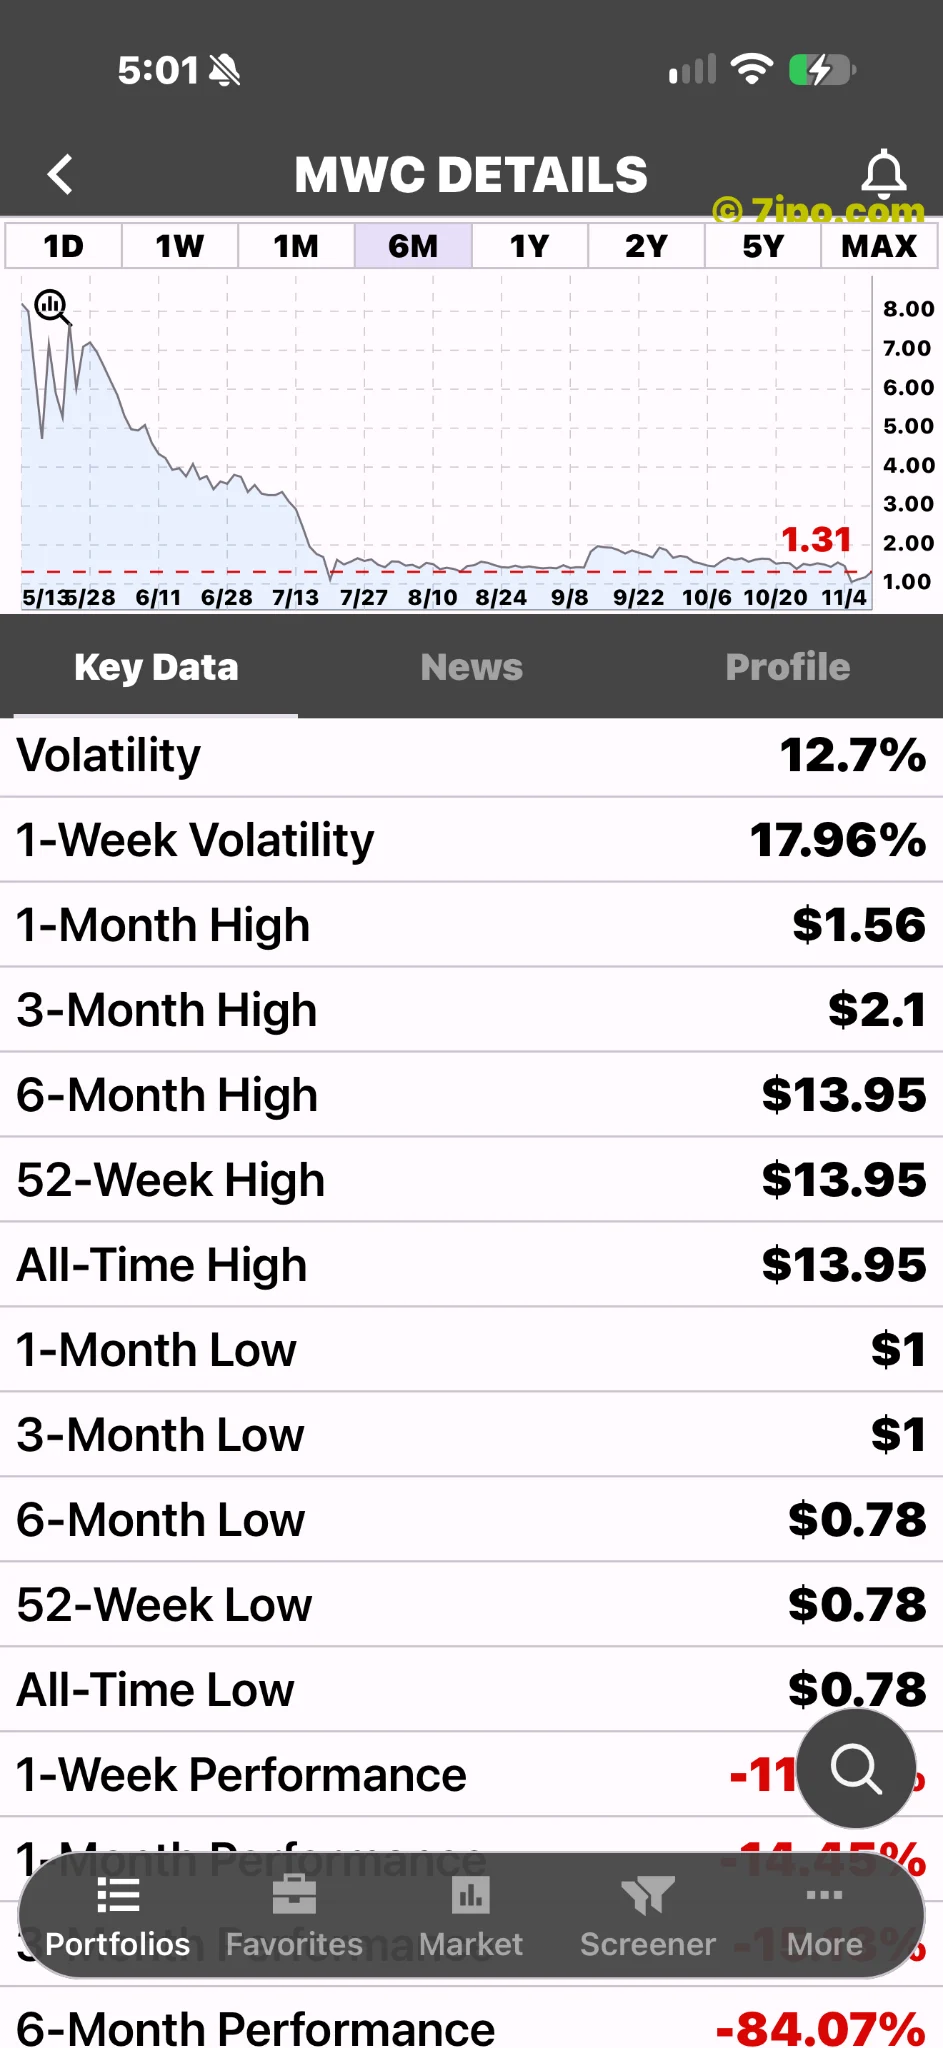
Micware’s ADSs began Nasdaq trading on May 14, 2026, after an $8-per-ADS IPO. The supplied $1.31 quote is approximately 83.6% below that offer price, a simple price comparison rather than an investor’s realized return. IPO closing announcement.
What matters next
Watch the relationship between gross margin, operating costs and net income, rather than treating a green quote as proof of a turnaround. A sharp percentage rise from a low price can coexist with a substantial loss relative to the offering.
Three questions behind the headline
First, is the improvement repeatable? A stronger gross margin tells readers that a larger share of revenue remained after direct costs. It does not establish that the same project mix, pricing or delivery efficiency will persist. Comparing several reporting periods would provide a better test than extrapolating a single half-year.
Second, what is the cost of the next stage? Research spending can depress near-term profit while supporting future products, but that possibility is not a guarantee of an attractive return. Investors should separate management’s strategic ambition from evidence of customer adoption and eventual cash generation. Cutting investment might flatter a short-term number while weakening a business; spending more without commercial results can also disappoint.
Third, which benchmark answers the question? The screenshot’s positive change describes one displayed comparison, while the gap to the IPO price describes another. Neither establishes the return earned by every shareholder. Entry price, holding period and transaction costs differ. A price below the offering also does not, by itself, prove that a stock is cheap: valuation depends on the earnings and cash flows the business can sustain.
These questions turn the story from a simple rebound headline into a business test. Better margins are encouraging evidence, but the relationship between revenue, costs and eventual shareholder returns remains the central issue.
Explore the supplied chart in IPO-Stocks.app. This is market reporting, not a buy or sell recommendation.