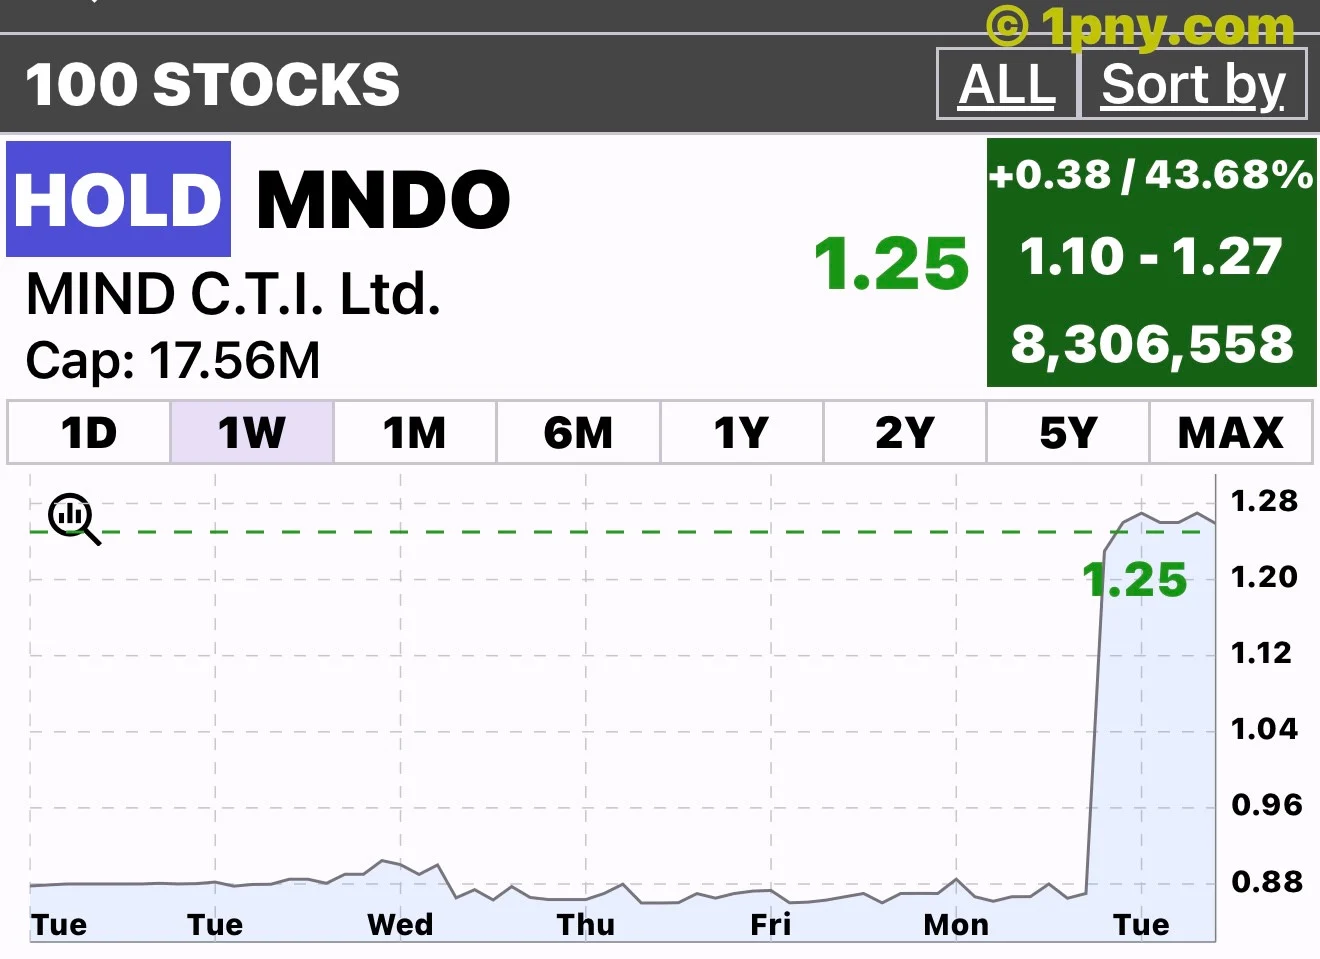
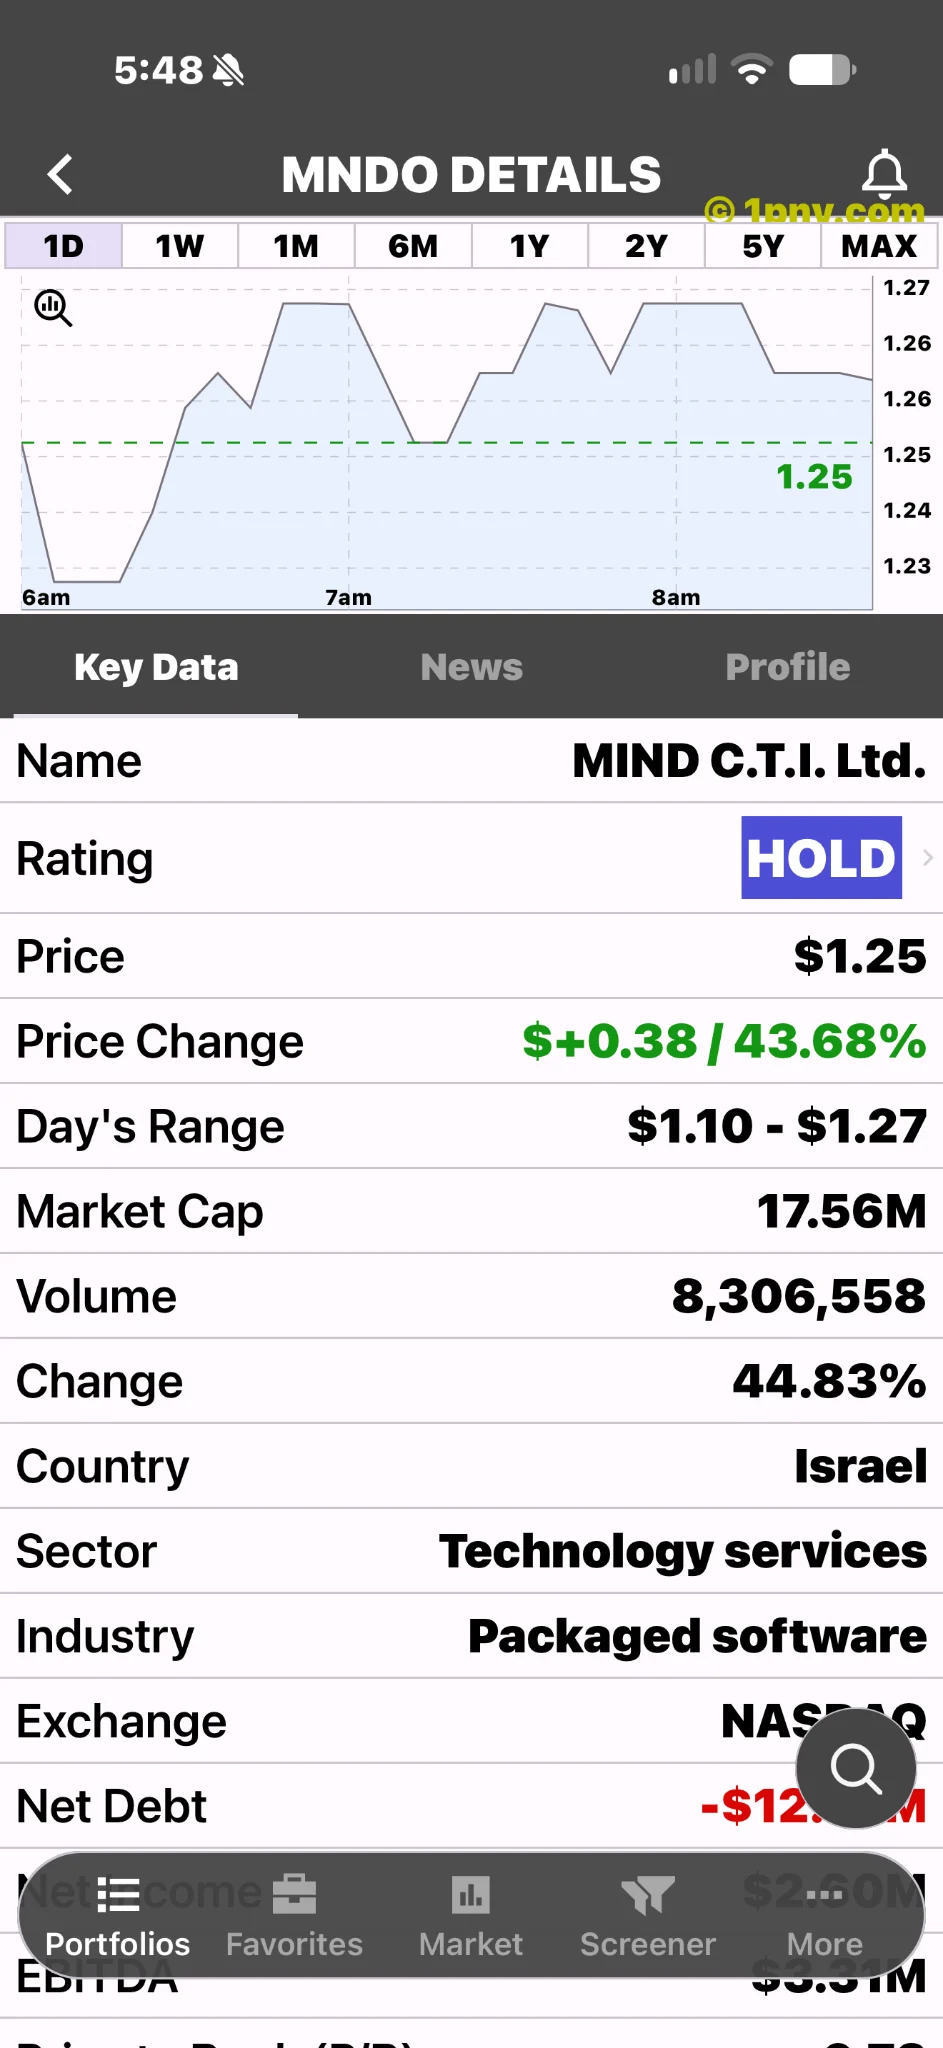
MNDO’s sharp move now has a concrete transaction to evaluate. The supplied Penny Gems weekly chart shows $1.25 and a 43.68% gain, bringing the displayed price close to the cash consideration in Enghouse’s proposed acquisition of MIND CTI.
That changes the immediate analytical question. The size of the jump is less useful for a new investor than the distance to the deal price, the time until payment and the risk that the transaction does not close.
A cash agreement becomes the central reference
In its November 10 announcement, Enghouse agreed to acquire MIND CTI for $1.30 per share in cash. Closing is expected in the first quarter of 2027, subject to shareholder approval and other conditions. Enghouse’s obligation has no financing condition.
MIND CTI’s company website describes billing, customer-care, unified-communications analytics and messaging products. A merger offers a different route for shareholders to realize value than waiting for the standalone business to grow.
The proposed cash consideration is a contractual figure, not a stock-market price target. It should be assessed alongside the transaction terms rather than treated as a guarantee that the shares will trade there immediately.
The snapshots show the jump, not a completed deal
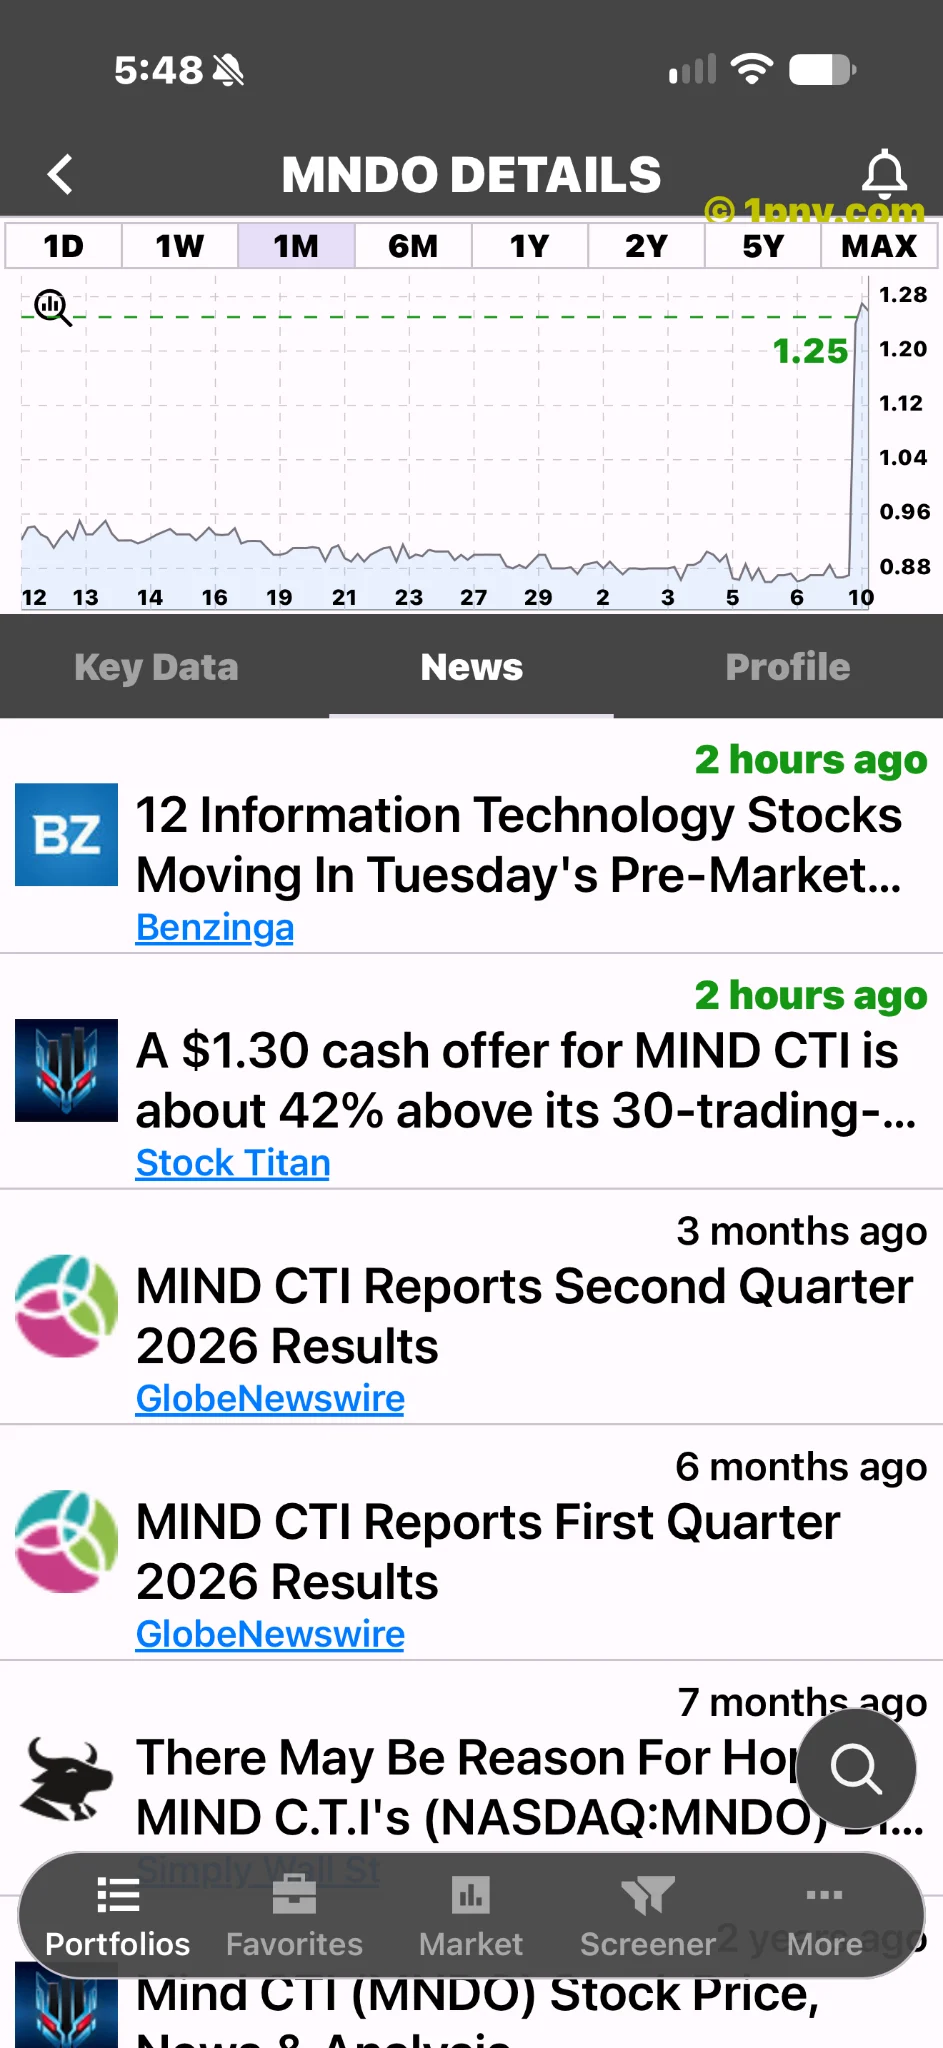
The weekly chart and intraday details screen both show $1.25 and 43.68%, with 8.31 million shares traded. The displayed range is $1.10 to $1.27. The weekly line jumps sharply from its earlier trading area near $0.88.
The initial gainers list instead showed $1.26 and 44.83%. These are separate readings. Some longer chart views also show a different current marker. The supplied images do not include a full capture date and time zone, so the figures are attributed snapshots rather than verified closing quotations.
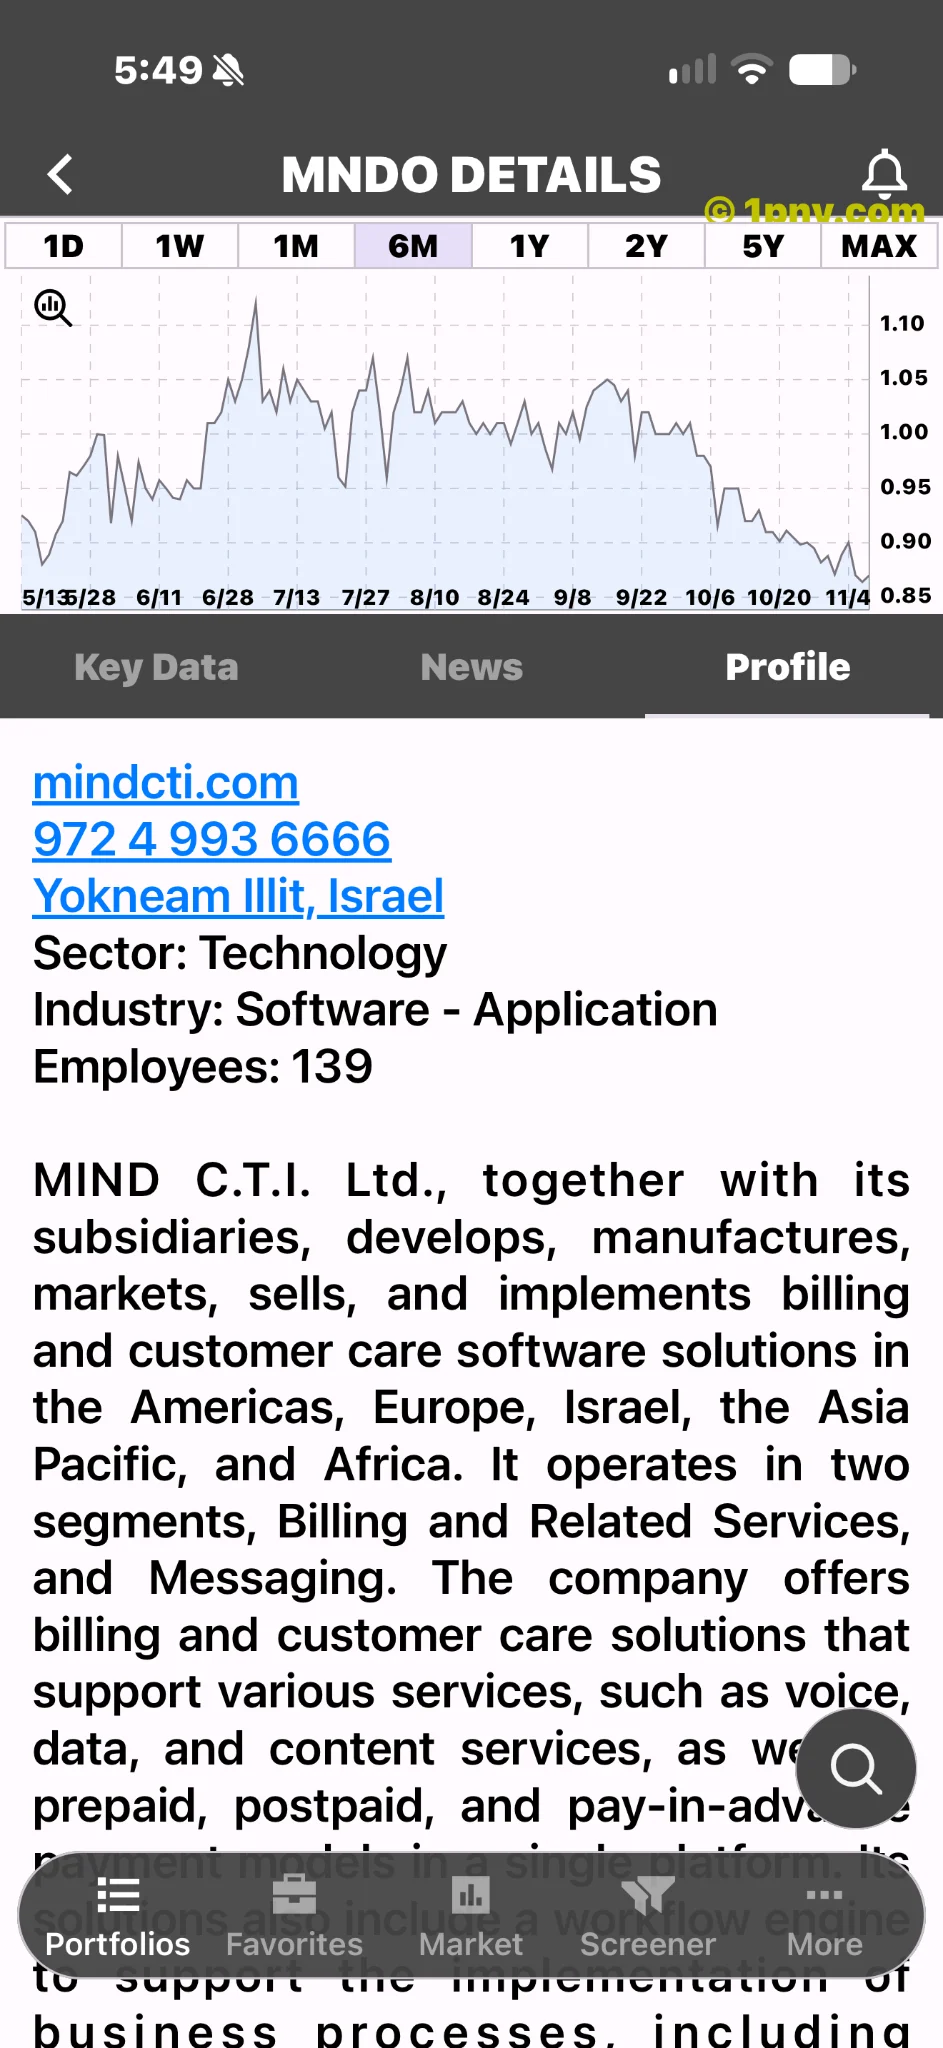
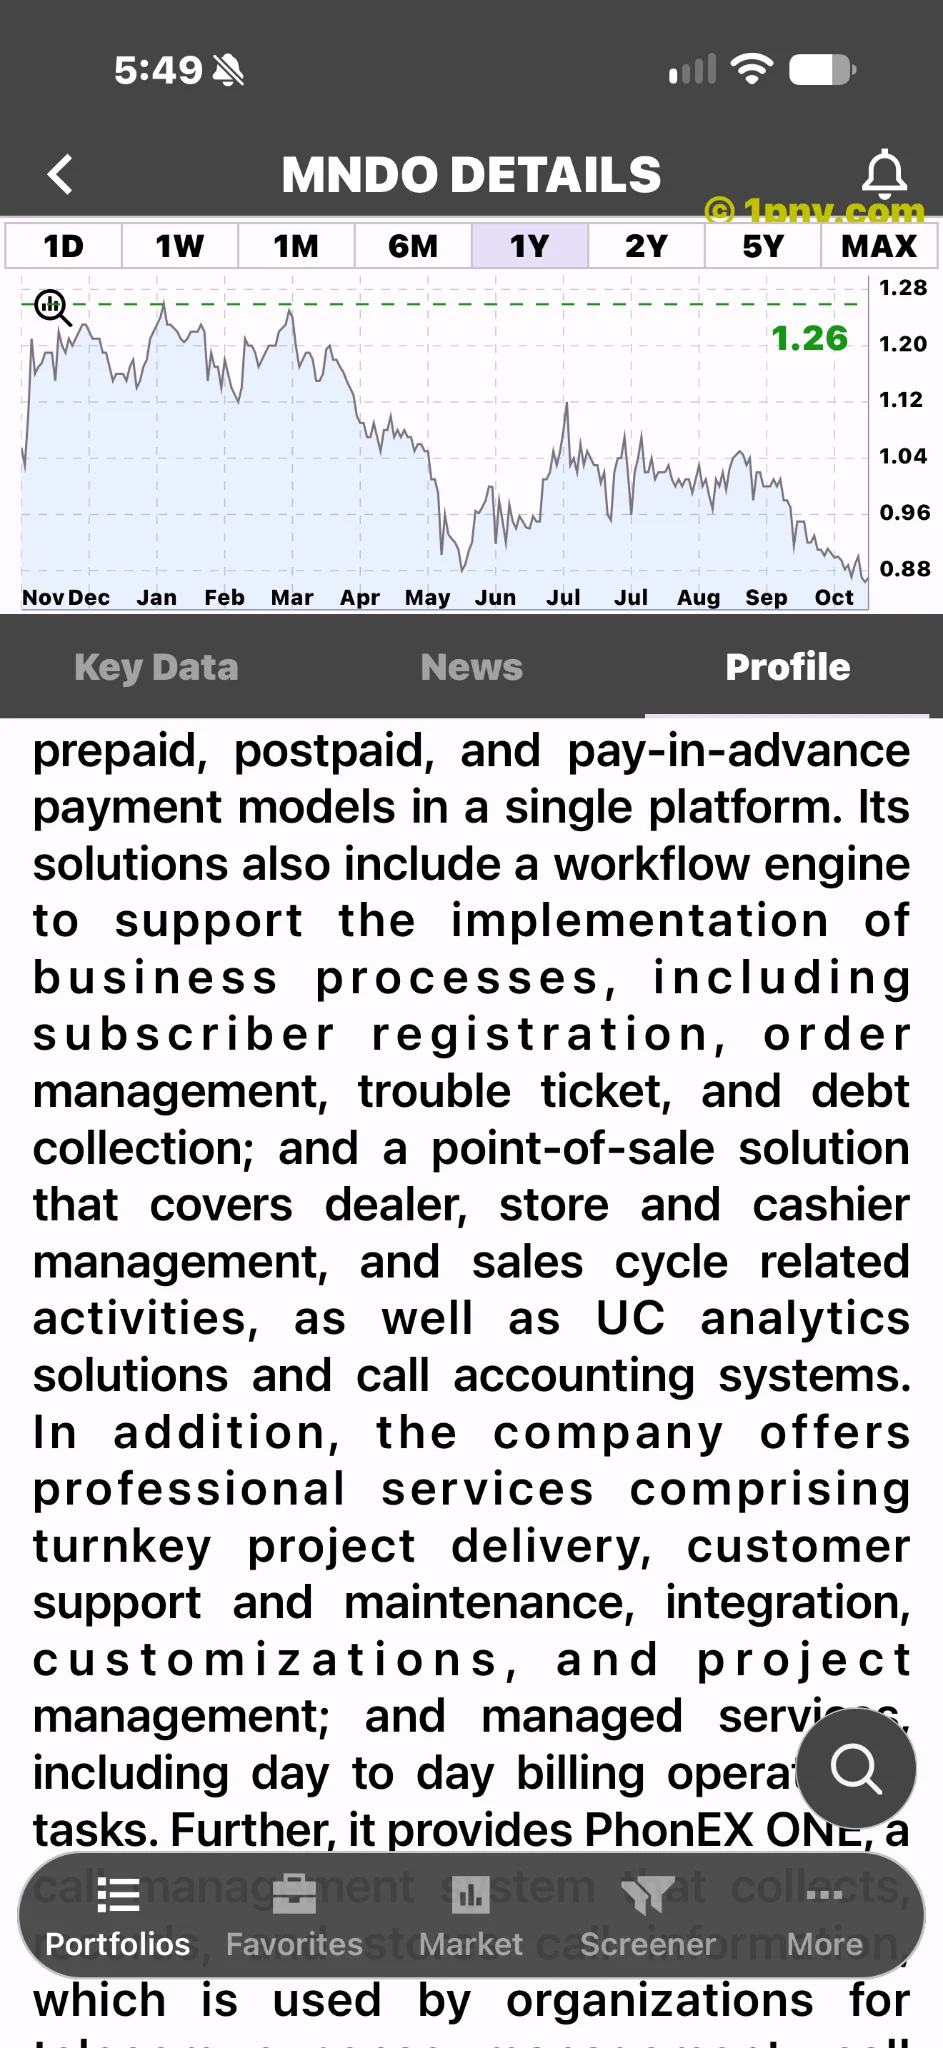
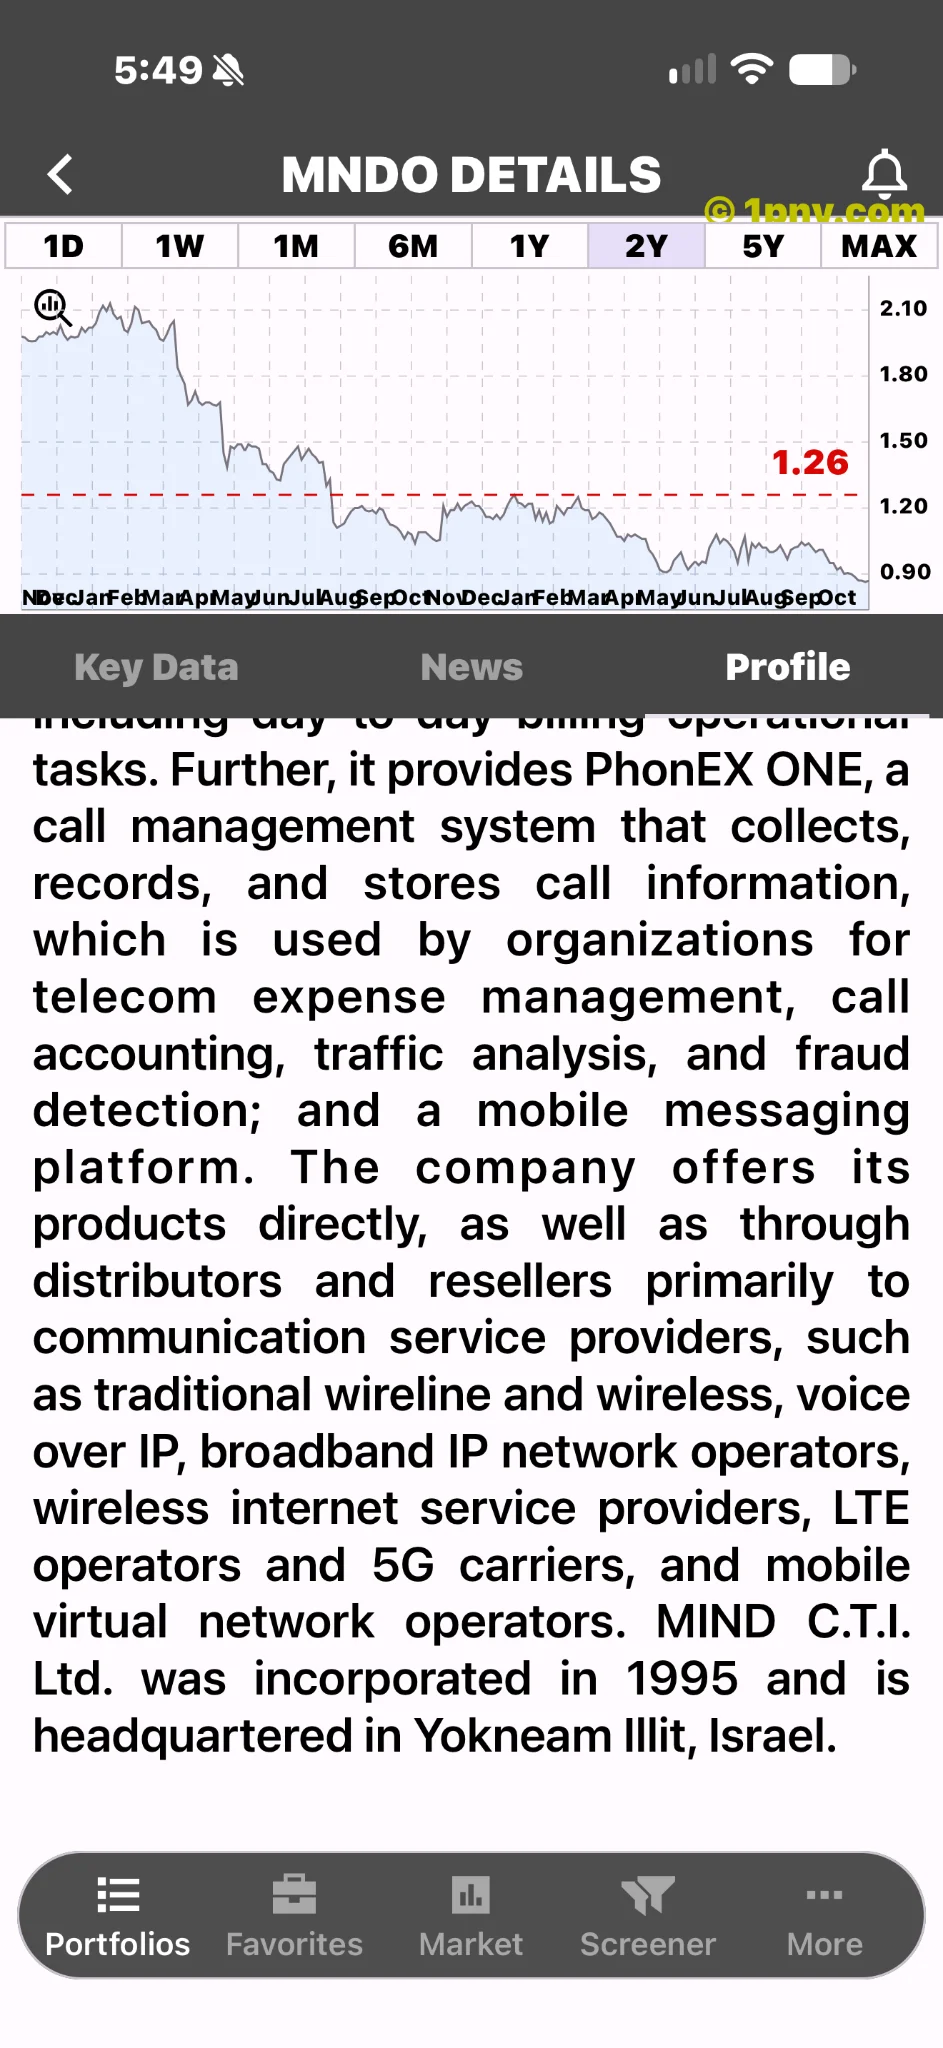
The one-month chart makes the abrupt change particularly clear. The six-month, one-year and two-year views show earlier weakness. That longer history helps explain the contrast on the screen, but it does not establish a fair standalone valuation if the deal fails.
Five cents is a conditional spread
Using the weekly screenshot’s $1.25 solely as an illustration, the difference to $1.30 is $0.05 per share, or 4% of that displayed price. This is a gross, non-annualized calculation before fees and taxes. It is not an available or guaranteed return.
The comparison changes with the actual purchase price. Paying more reduces the remaining spread. A later closing would also tie up capital for longer, while a failed transaction could leave the investor holding an independent business whose market value is uncertain.
A large already-recorded percentage gain therefore does not imply similar upside remains. Nor does a small gap to the cash price make the trade risk-free. The possible downside and the remaining upside need to be considered separately.
What matters before completion
Readers should follow the shareholder materials, the approval process and any changes to the announced terms or expected timing. The decisive event is completion, not the appearance of a merger headline in a news feed.
The screenshots cannot measure the probability of closing. Heavy trading is evidence of turnover, not proof that participants agree about the outcome. A smooth-looking chart after the jump also cannot remove contractual or business risk.
This is market reporting, not a recommendation to buy or sell. HOLD is the app’s label, not this article’s advice.