iHeartMedia brought in more revenue in the third quarter, yet its investment story became much harder to defend. Revenue rose 3.3%, but adjusted EBITDA fell 16.7%. Then came the bigger disappointment: management sharply reduced what it expects the business to earn and turn into cash this year. Growing sales are encouraging. Growing sales alongside falling profitability and lower expectations are a warning that the recovery is not reaching shareholders in the way they might have hoped.
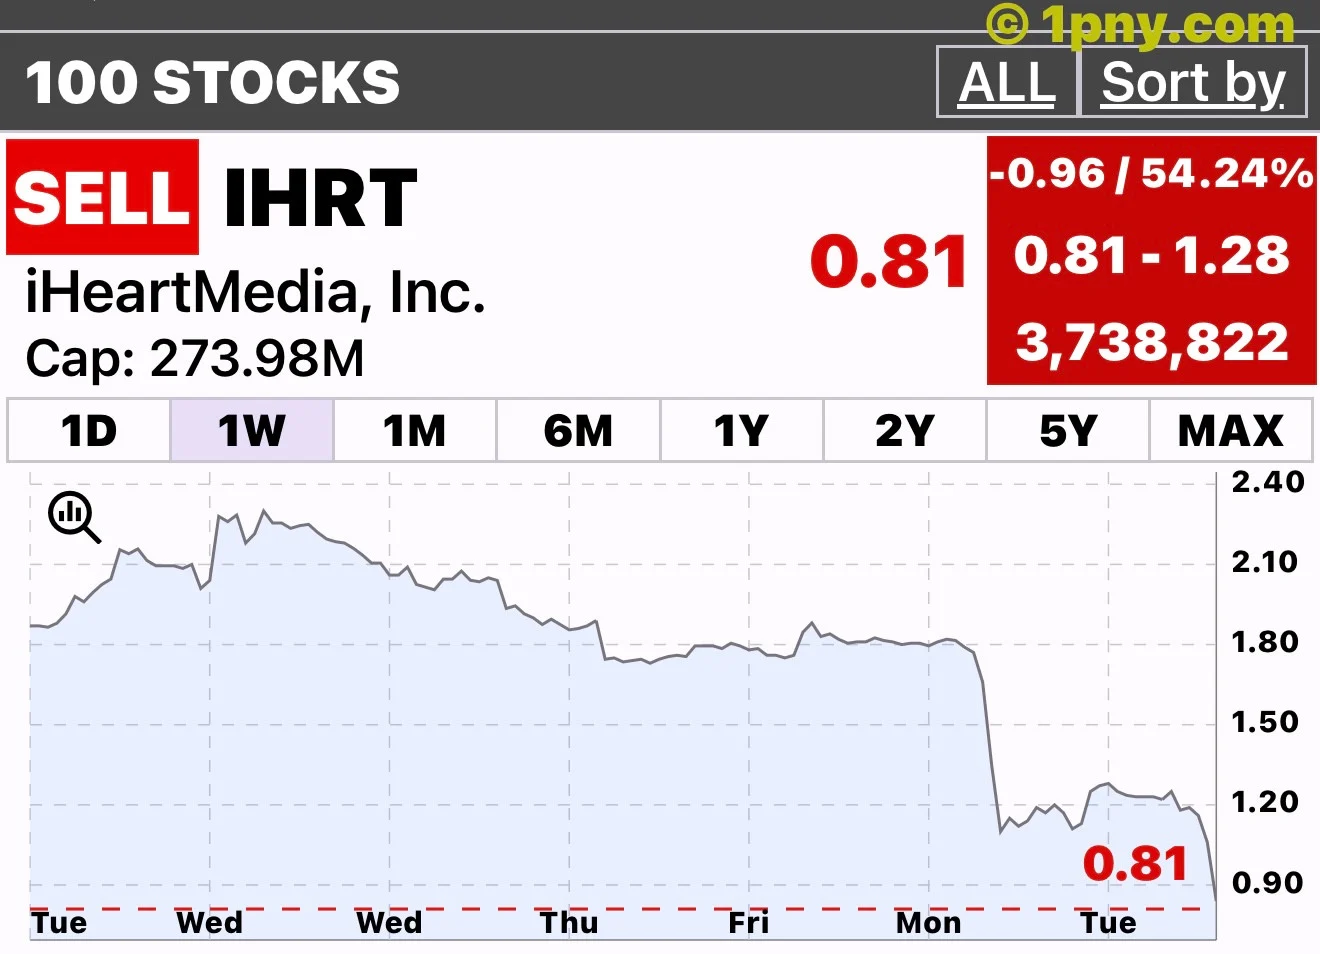
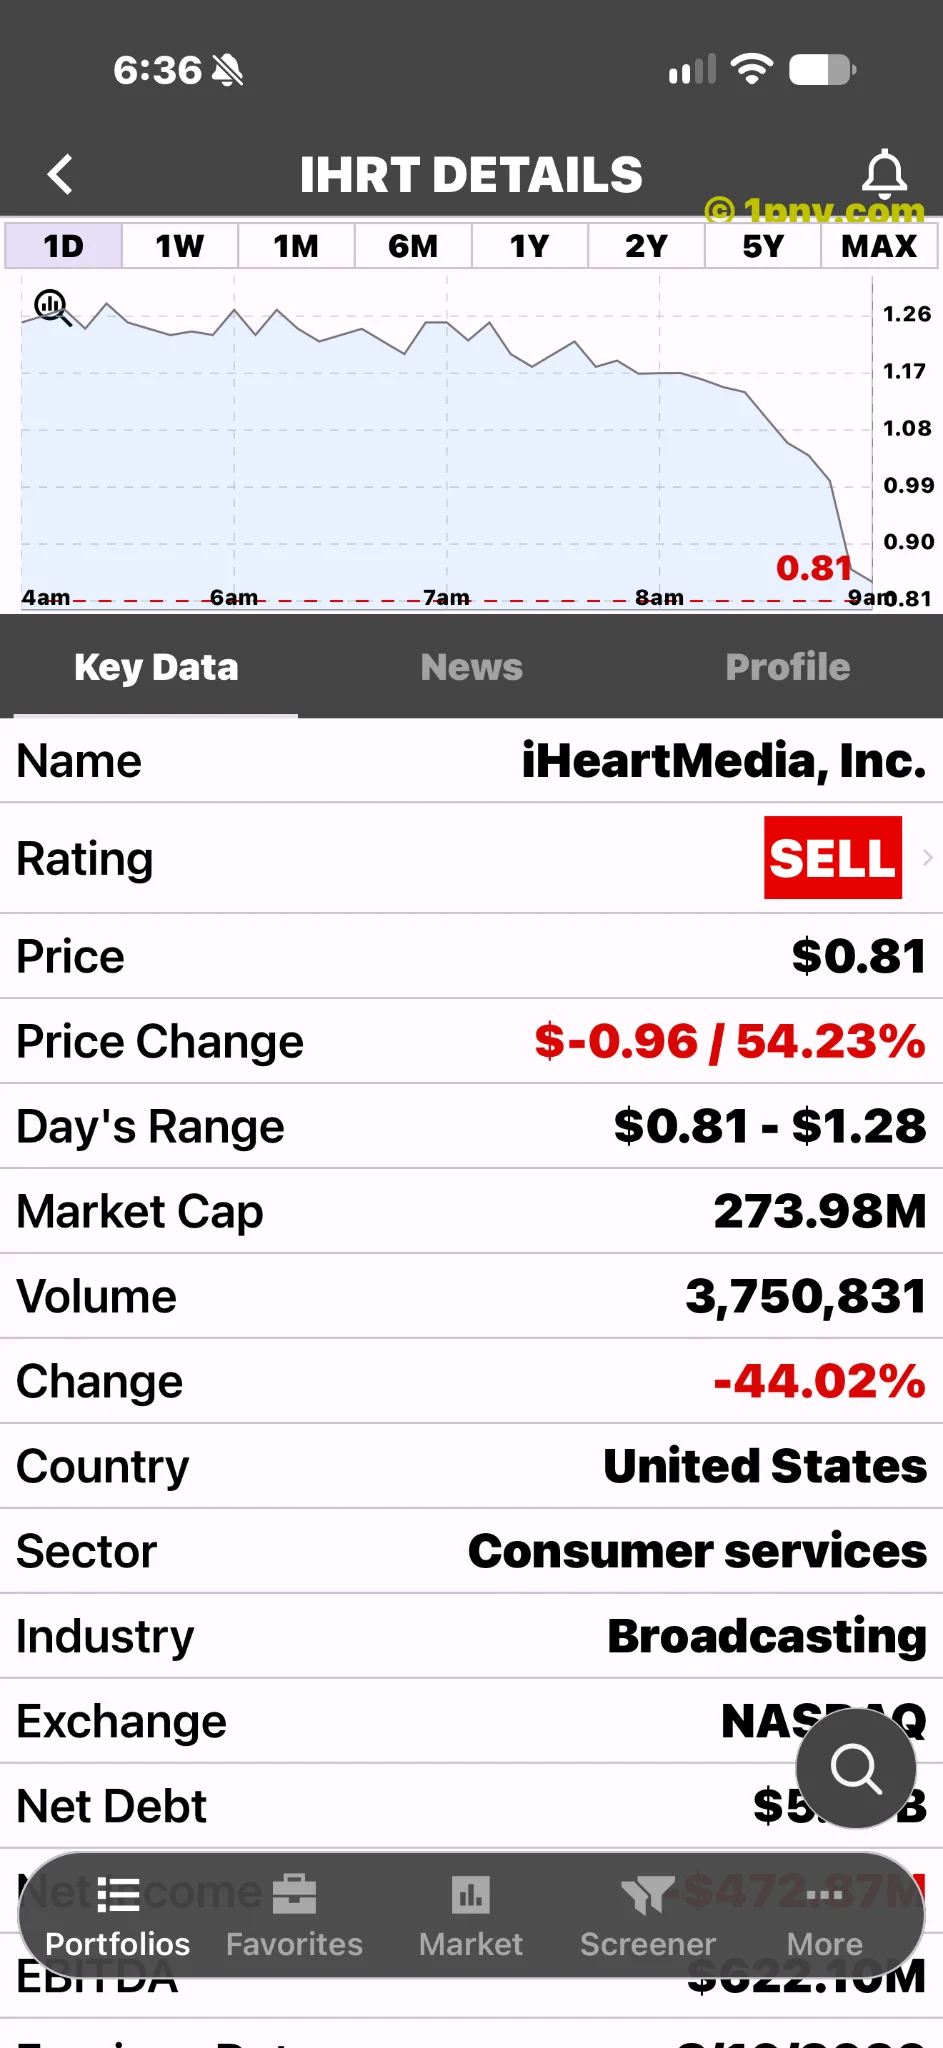
The supplied market snapshot showed IHRT at about $0.81, down 54.24%. That is a captured quote, not a verified closing result. The November 9 earnings update provides a strong explanation for the selling pressure, although its timing cannot establish the motive for every trade.
The promise became much smaller
In August, iHeartMedia had projected approximately $800 million in adjusted EBITDA and $200 million in free cash flow for 2026. It now expects adjusted EBITDA of $550 million to $600 million and free cash flow of about $50 million.
The new EBITDA midpoint, $575 million, is approximately 28% below the earlier target. The cash-flow forecast is 75% lower. Those calculations compare management’s forecasts, not changes in the company’s market value, and the forecasts themselves remain uncertain.
This is the most troubling part of the update. Investors were not simply asked to look past one difficult quarter. They were given a substantially smaller estimate of the earnings and cash generation available across the year. A business can recover from a disappointing quarter, but such a large reset makes the next promises harder to take on trust.
More sales did not deliver stronger profits
Management described weaker political advertising for radio, delayed advertiser spending and a faster shift toward automated ad buying. These are management’s explanations of the operating shortfall, rather than independently established causes of the share-price decline.
The damage was particularly visible in Multiplatform, where adjusted EBITDA fell 42.9%. Against that backdrop, the increase in total revenue is a welcome sign that the business is still attracting spending, but it offers limited comfort. More sales are only part of the recovery story. The harder task is keeping enough of those sales to strengthen profitability and cash generation.
That distinction matters for the advertising strategy. A transition toward new buying methods may offer opportunities, but shareholders need evidence that execution can improve margins, rather than just produce a bigger revenue number. The quarter leaves that question open.
The accounting needs care, and the debt needs cash
The fourth-quarter outlook includes roughly $100 million of negative non-cash marketing impact. It would be misleading to describe that as an equivalent cash payment. Management also said those expenses were already anticipated, so they should not be presented as the sole new explanation for the guidance cut.
Adjusted EBITDA and free cash flow tell different parts of the story. EBITDA measures performance before interest, taxes, depreciation and amortization; the adjusted version includes additional company adjustments. Neither should be mistaken for cash available to shareholders. Debt service and capital spending still matter.
The September filing reported about $4.68 billion of net debt. Management also considered liquidity sufficient to fund operations for at least another twelve months. That assessment offers some reassurance about near-term funding. It does not prove the equity is safe or make the debt burden disappear. With creditor claims ahead of shareholders, a smaller cash-generation outlook deserves particular attention.
A dramatic chart, an unfinished recovery
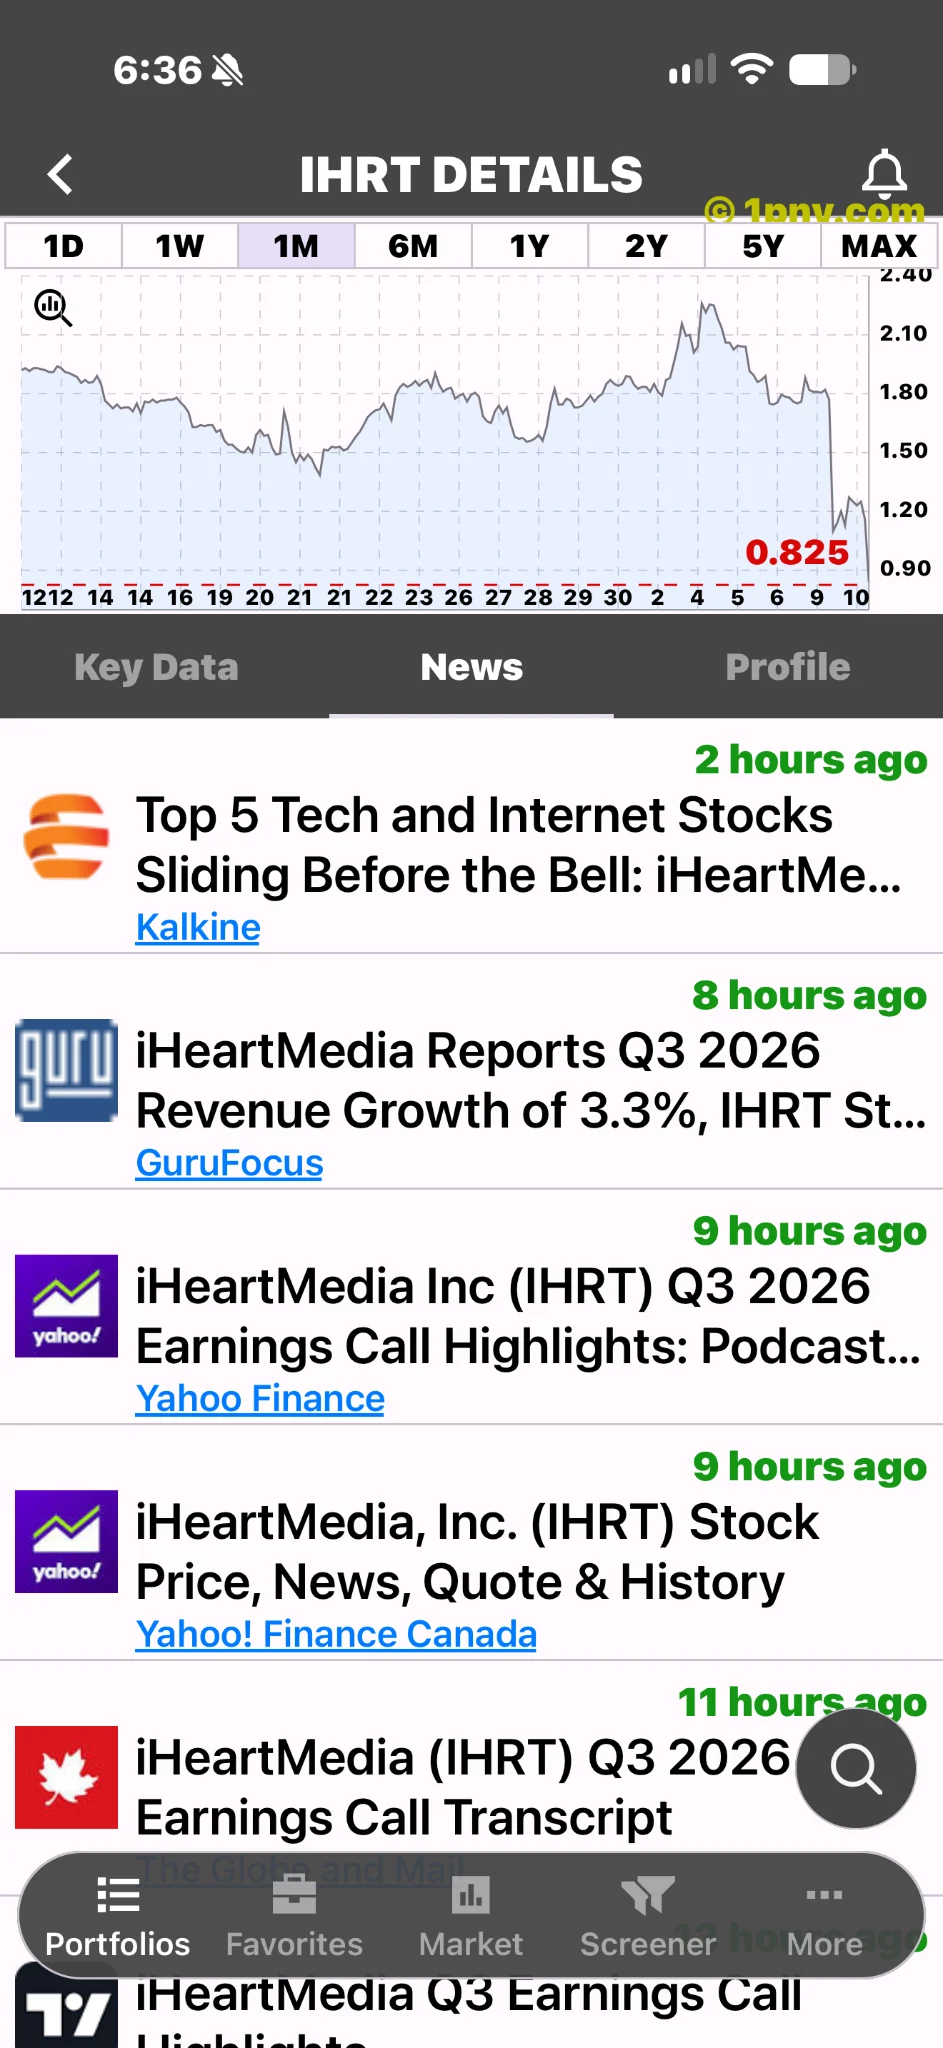
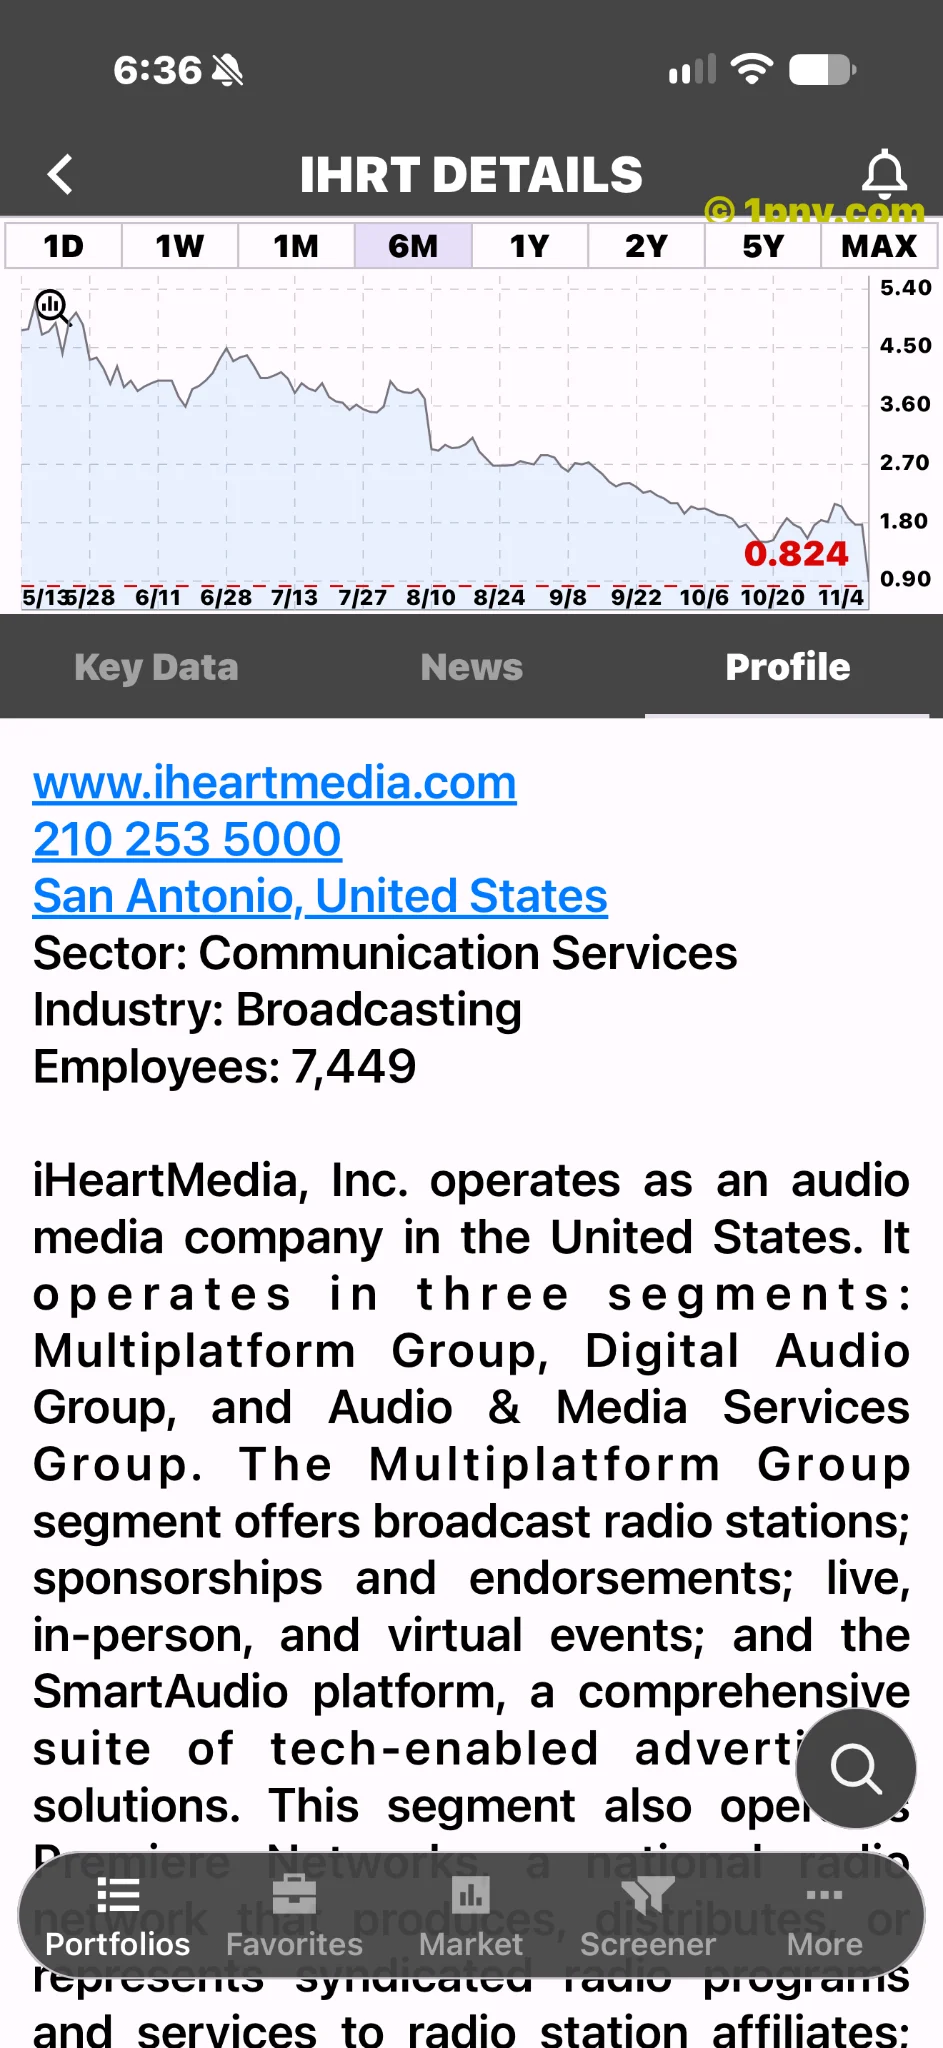
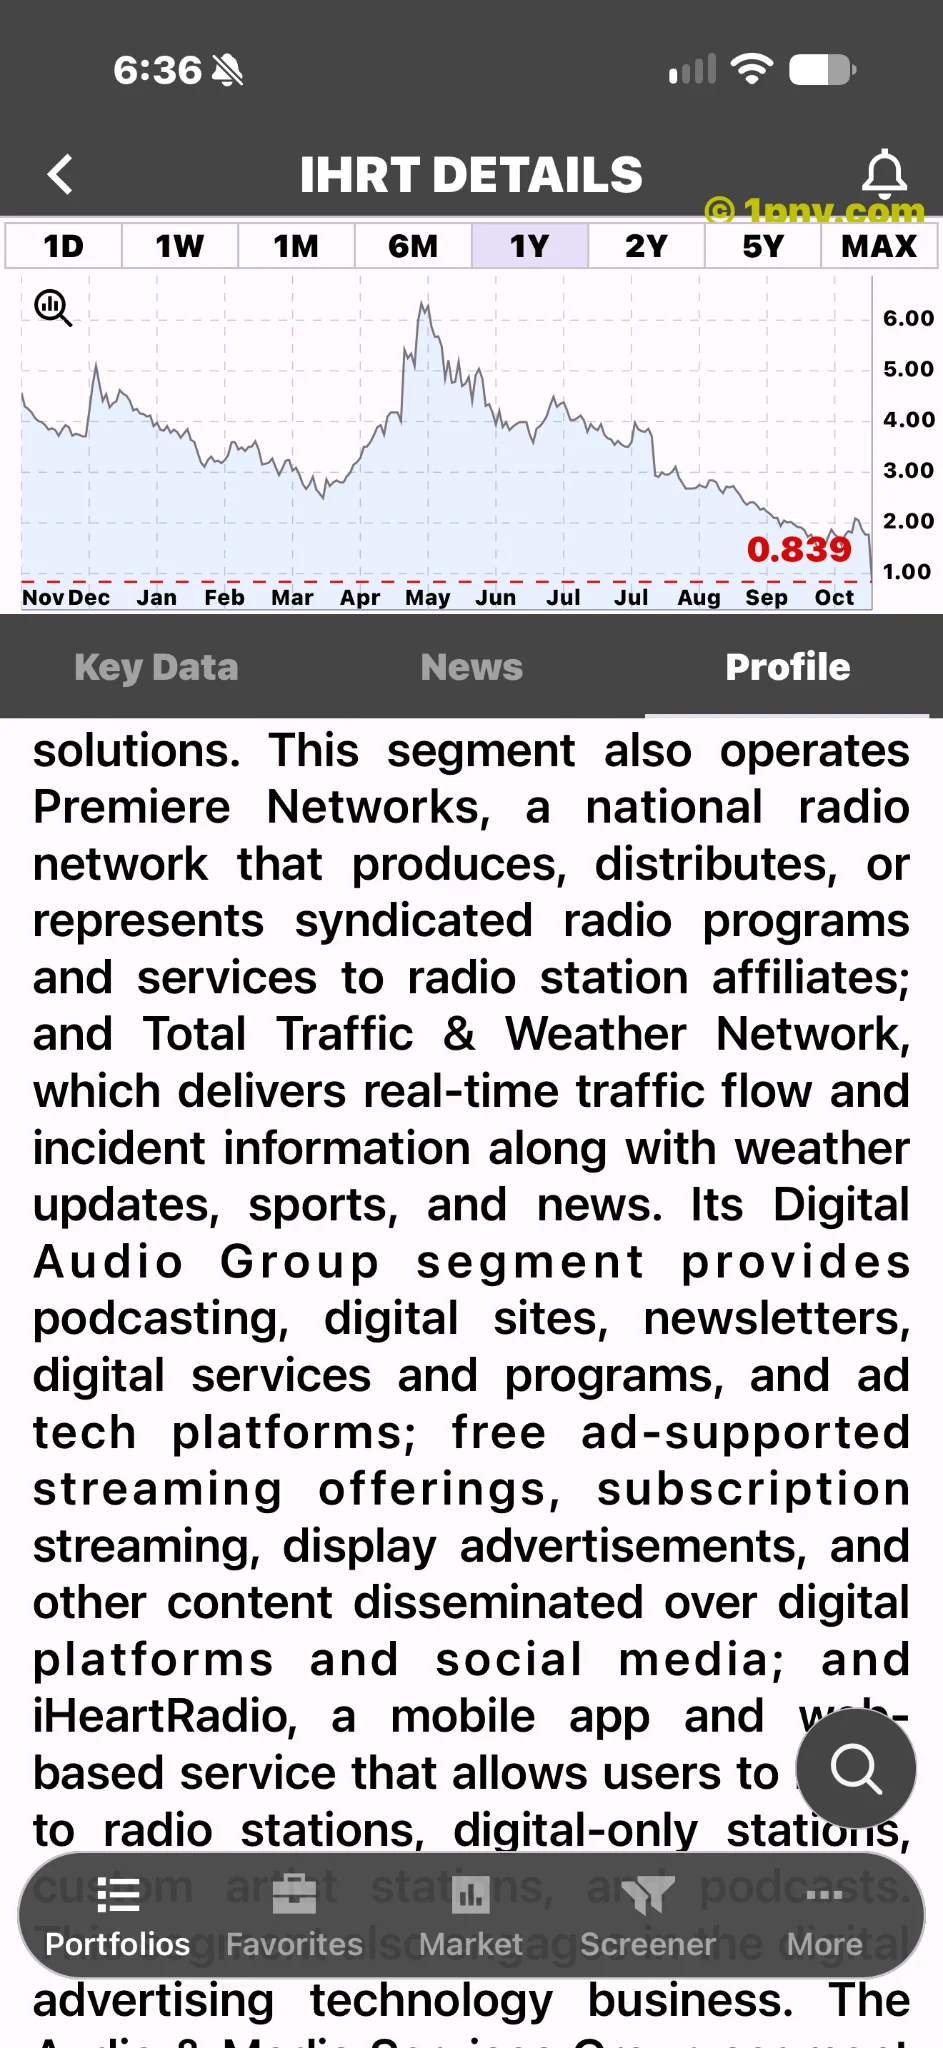
The supplied one-week chart captures the price at a particular moment. Its displayed percentage should not automatically be treated as the return across the entire visible period. Without verifying the timestamp, trading session and comparison baseline, it cannot establish a final daily return or completed weekly performance.
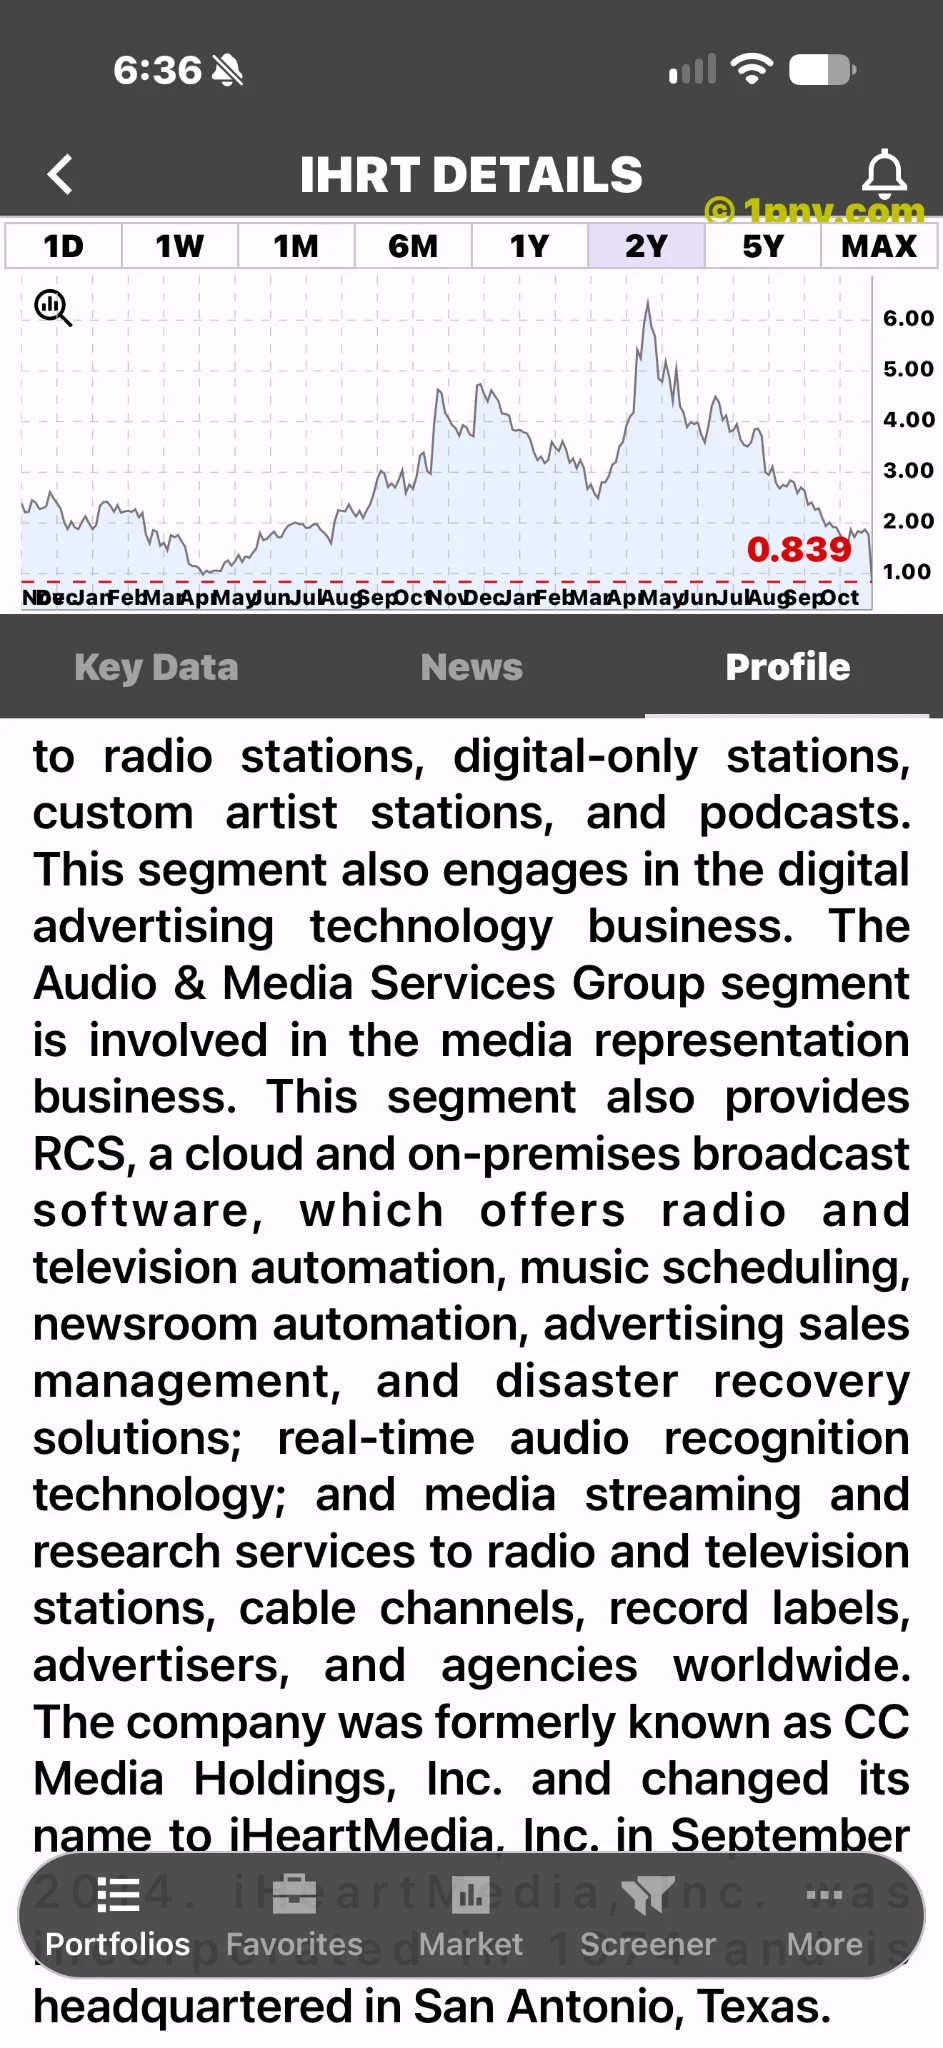
It also cannot reveal who sold, whether short sellers drove the move or whether forced liquidation occurred. Those claims need separate evidence.
The fair assessment is uncomfortable but balanced: revenue growth is a positive, while weaker profitability and sharply reduced forecasts are serious setbacks. The liquidity assessment helps, but the next convincing chapter must be written in cash generation and better advertising execution. A steep price decline alone does not make the remaining equity inexpensive. Future comparisons should use consistent periods and metrics, separating accounting effects from operating progress and operating progress from valuation.
For information only. Not investment advice.